I wasn’t sure how to label in Google Fusion tables(oops), but in my graphs the X axis represents the publication year and the Y axis represents theme frequency. Overall, I liked thinking about the graph results and musing over what the data might represent.
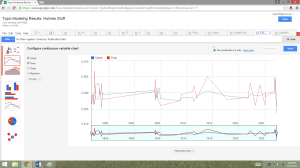
Gun: There was a large increase in this topic from December 1st 1893 to October 12th 1893. In 1893, The Final Problem was published. Although Holmes dies (insert massive question mark here) in the story, it isn’t gun related. He plummets to his death (insert another massive question mark here) at Reichenbach Falls with Moriarty. However, he is beaten with a police baton, so maybe my topic is faulty. The topic drops the next year, rises again in 1904, and then falls until 1911. After this, the graph experiences spikes in 1917, 1922, and 1925. I looked up guns in Victorian London using victorianlondon.org, and found an entry detailing a gun involved murder from 1876. Given the later dates, and presuming that I didn’t mess up to topic, maybe it’s that guns became more available, and recognized in crime stories.
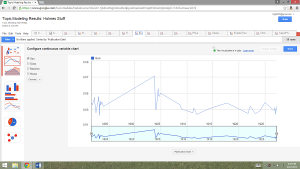
Clues/Reaction: Immediately, I saw a slight similarity between these two graphs. Initially it made me wonder if the “reaction” topic correlated to the “clues” topic in the text. Sherlock sees the document and he laughs or something like that. Save 1911 and part of the early 1920’s, the lines follow the same general pattern, although “clues” tend to see a higher frequency, and a spike December 1st 1903 (0.14). Interestingly enough, an increase can be seen in 1917, when His Last Bow:Some Reminiscences of Sherlock Holmes was published. It’s a collection of the previously released stories, which might explain the emphasis on past clues in cases rather than reactions.
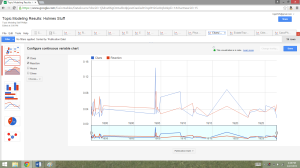
Estate/Travel/House: Given the emphasis on travel out into the country to homes and estates that we discussed in class, I thought it would be interesting to look at all three topics together. Also, considering the heavy Victorian emphasis on domesticity and home comforts alongside world travel and colonization, it seemed like a fun study. In the first and second graph portions, “travel” and “house” match up fairly well. In 1893, all the topics spike. This timeline shows that in 1911, there was industrial unrest, resulting in transport, railway, docks and coal strikes lasting until 1914. This is odd, given that travel shows an increase alongside estate In 1911. The house topic sees a huge increase in 1913. Maybe this spike could something to do with the impending war, and a push to stay at home. By 1921, house is at .06 and travel is at only .02. By the mid 1920’s, both house and estate appear more frequently than travel. In 1927, however, travel catches up to house and estate. Here’s a link to a blog post about British air travel in the 1920’s, and although I don’t think it explains the spike, it’s pretty neat to think about.
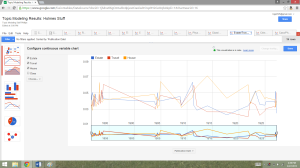
Physical Description/Case: Given their basic nature, there isn’t too much that makes them historically significant. Instead, I focused on what the topic labels mean. Both words relate to genre expectations. The “Physical Description” category exists in all stories, something that enriches character development. It is a crucial facet in constructing a story. The “case” category is another expectation, given that Sherlock Holmes stories are from the mystery/detective subgenre of writing. Case experiences a spike January 16th, 1893 (0.12) , and again December 1st, 1926 (0.2). Besides a smaller spike in March 16th, 1904 (0.07) , and March 1st, 1922 (0.1), the Physical Description topic remains less jagged at the end of the graph.
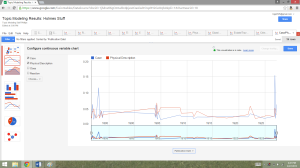
Crime/Time: I didn’t just group these topics together because they rhyme…It turns out that they have some interesting reflections. August 1st 1893, time goes up, and crime goes down. There’s a similar pattern, then December 1st , 1903 time goes up, and crime goes down. May 1st 1911, time and crime reflect. Time rises again December 1st 1913, then steadily declines into September 1st 1917. At the end, time zig zags a bit. Crime remains relatively calm comparatively, but also experiences increases/decreases. Crime’s lowest point is at August 1st 1893, at .03. At the end of the graph, April 1927, both topics experience a decline (.03 and .02). Again, I figured that the steady nature of crime as a topic was due to genre expectation. Given my basic knowledge, I tend to connect Victorian men’s fashion with pocket watches, and therefore, time. Often in the Holmes stories, time connects to response to a crime or event. I’m assuming it would connect to train schedules and travel/movement as well.
