https://www.google.com/fusiontables/DataSource?docid=1jNGQNPrwU-j8oWzP-gU5fKlYIC9CWThhZDruIx29
Google Spreadsheet Info


Cards


map locations of videos


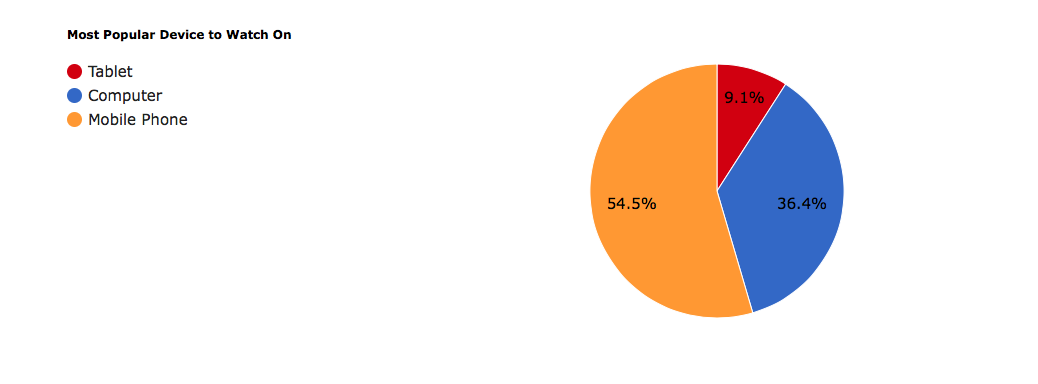
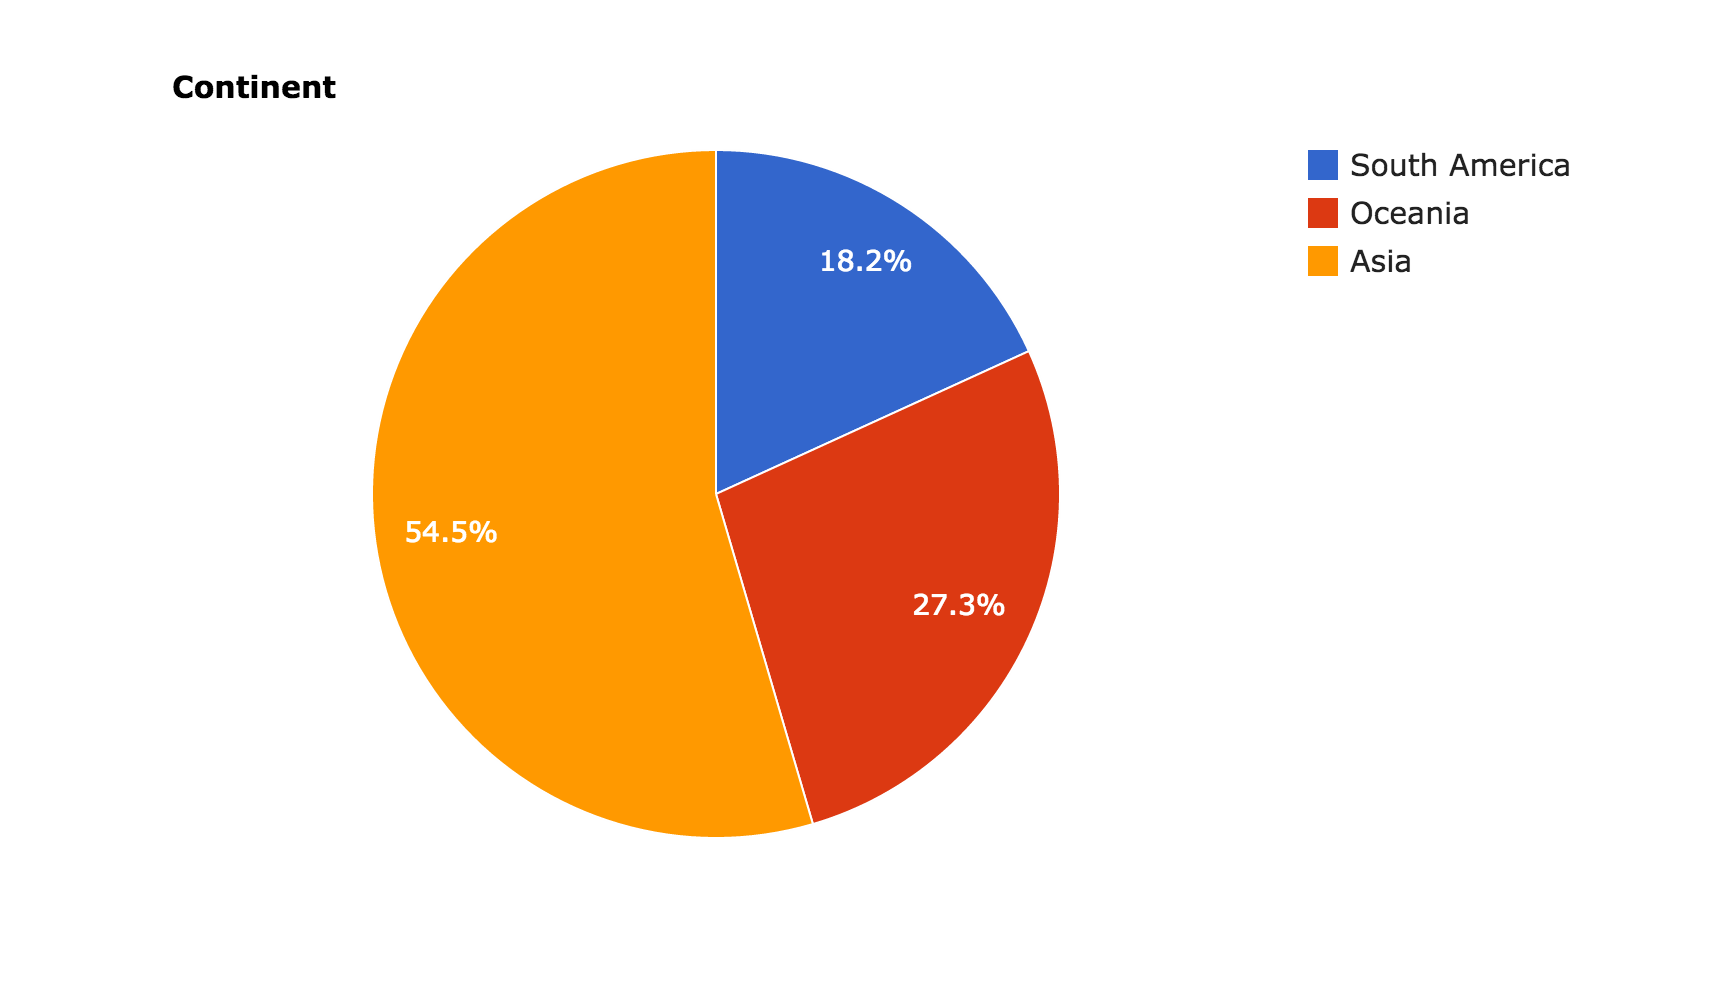
Pie graph
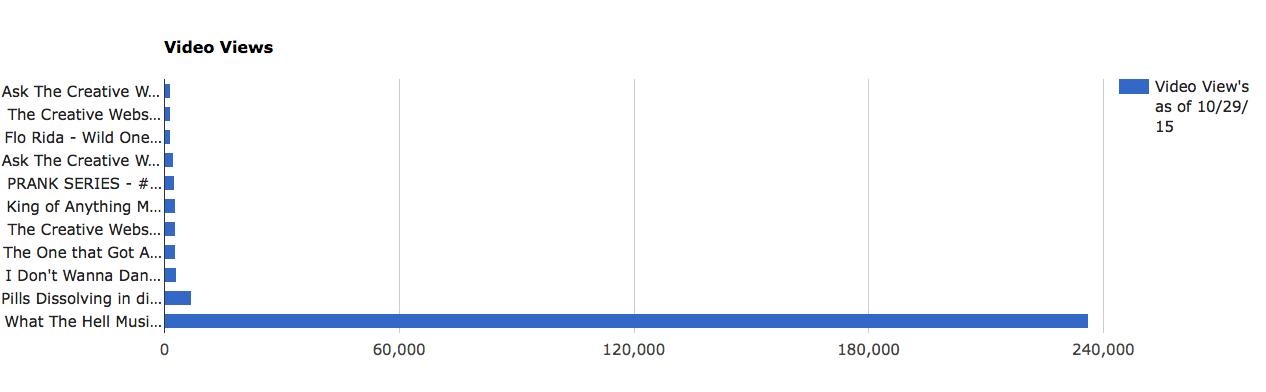
Bar graph
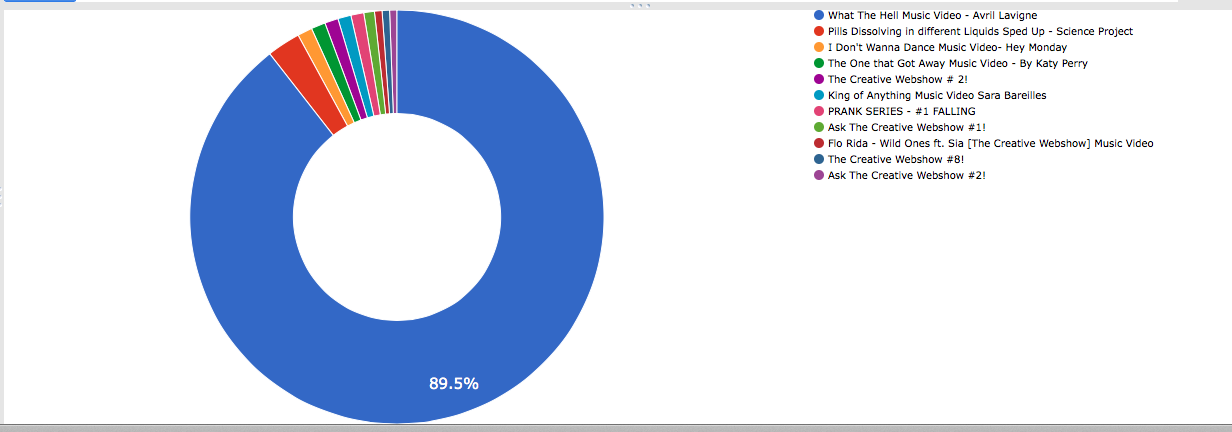
Donut graph
https://www.google.com/fusiontables/DataSource?docid=1jNGQNPrwU-j8oWzP-gU5fKlYIC9CWThhZDruIx29
Google Spreadsheet Info
Cards
map locations of videos
Pie graph
Bar graph
Donut graph
Hey everyone,
Hope you all enjoy our blog on Death Eaters in the Harry Potter series! We will explain more about it tomorrow, but for now, have fun looking around.
https://deatheaterstudies.wordpress.com/
-Hannah, Jen, and Tina
I wasn’t sure how to label in Google Fusion tables(oops), but in my graphs the X axis represents the publication year and the Y axis represents theme frequency. Overall, I liked thinking about the graph results and musing over what the data might represent.
Gun: There was a large increase in this topic from December 1st 1893 to October 12th 1893. In 1893, The Final Problem was published. Although Holmes dies (insert massive question mark here) in the story, it isn’t gun related. He plummets to his death (insert another massive question mark here) at Reichenbach Falls with Moriarty. However, he is beaten with a police baton, so maybe my topic is faulty. The topic drops the next year, rises again in 1904, and then falls until 1911. After this, the graph experiences spikes in 1917, 1922, and 1925. I looked up guns in Victorian London using victorianlondon.org, and found an entry detailing a gun involved murder from 1876. Given the later dates, and presuming that I didn’t mess up to topic, maybe it’s that guns became more available, and recognized in crime stories.


Disclaimer: These historical crushes do not reflect my personal values. Unless you simply take personal values as taste in men.
The location is associated with the people’s estates or homes. Here’s the link.


After many thoughts about what to chart and map using the Google Fusion service, I decided to document some of the cities I visited this past summer during my study abroad adventure in Germany. I mapped the various cities and their populations. I was curious to see how many people live within each city after visiting and experiencing them. Each category links to the original charts.
Here is an overview of the ten cities I visited or traveled through. I included the city name, country, an image, and the geographic location with latitude and longitude coordinates.

Below is a physical map that highlights each of the cities.

This pie chart demonstrates the city populations.

This graph also charts city populations ranging from smallest city to largest.

This network visualization shows the relationship between each city and its population.

Erica Gedney
Contending Teams

Contender Locations

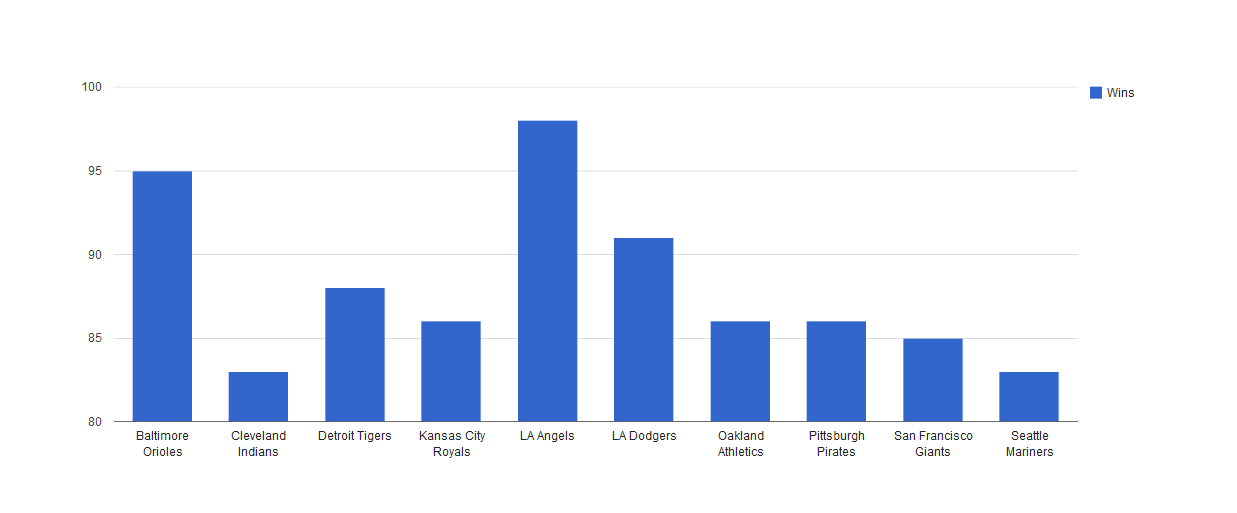
Regular Season Win Total Comparison
Berth Origin Comparison
Separates the contenders based on how they are contending, whether it be contending as a division champion, wild card champion or a team still eligible to be a division champion and a wild card champion.

League Comparison
Shows how competitive each league still remains going into the last weekend before the playoffs begin, based on how many teams still haven’t been eliminated.

Link to Google spreadsheet:
https://docs.google.com/spreadsheets/d/12mjxzeJciCtRS9S9_dyzPoYW9S9yk-2T583x0vXTZ7c/edit#gid=0
Link to Google Fusion Table
https://www.google.com/fusiontables/data?docid=1kL3NS9Hk0iZ1T3nd-eORRWfU213tmGGa9i4q9pjT#chartnew:id=6


Works Cited
“Earthquake Hazards Program.” Earthquake Hazards Program. U.S. Department of the Interior | U.S. Geological Survey, 14 Apr. 2014. Web. 26 Sept. 2014.
By Mary Dellas


