Visualization of the Cislunar Potential

Visualization of the Cislunar Potential

In the past few days I’ve been following the playback of the Apollo 11 mission in “real time” (delayed exactly 50 years) at https://apolloinrealtime.org/11/.  Among all the news related to the 50th anniversary of the Apollo 11 moon landing I also found an article from NPR about about 3 different approaches to how to get to the moon, and how the one they used almost wasn’t ( Meet John Houbolt: He Figured Out How To Go To The Moon, But Few Were Listening).  This has caused me to think a bit about how to visualize the gravitational potential between the Moon and Earth (“cislunar”1) and how the path chosen for the mission was somewhat like a car driving up a mountain to go over a pass to a valley on the other side.   As a result, I wrote a short Python script to show the potential as a surface over a 2 dimensional plane, and then “played” with the color map and other effects to highlight that “mountain pass” between the Earth and the Moon.

I’ve included a derivation of the equation for the gravitational potential for those who are interested, but it’s down at the end (for those who are not).  The Python script which was used to create all these images is at http://www.spy-hill.net/myers/astro/cislunar/CisLunar.py.  See the comments in the code for the small changes needed to turn one into the other.

Visualized as a Terrain Map

This first plot shows the potential surface with a color map commonly used for terrain, where sea level is blue, lowlands are green, mountains are brown, and mountain tops are white:

Figure 1: Cislunar potential using a terrain color map.

The idea is that going to the Moon is like climbing a mountain. Going up a hill increases your gravitational potential energy, and the same is true when a spacecraft goes up this surface on the way to the moon.  The blue at the bottom of the left potential well is the Earth, and the dimple up the hill to the right is the Moon.

The x and y coordinates on this figure are measured in units of the radius of the Earth (symbol R). The vertical scale is logarithmic2 to make it easier to see the variation on a reasonable scale. The horizontal spacing is to scale: the Moon is a little over 60 Earth radii from the Earth.   The bottom of each potential well is flat and to scale.  That shows the small size of the Earth and the Moon compared to the distance between them.

Viewing from the side shows the variation in “elevation” a little better:

Figure 2: Cislunar gravitational potential with a terrain color map, side view.

Now you can at least start seeing the idea that going to the moon is like going up a mountain and then down into a valley.

Visualized with Color Contours

The problem with the images above is that the color map changes gradually, so you cannot see the subtle changes at the “mountain pass”.   To help visualize that more clearly I switched to an artificial color map3 which varies between colors more often and uses more distinct colors.  Here is the result:

Figure 3: Cislunar gravitational potential using the ‘prism’ color map to show smaller changes.

Now you can see that the “mountain pass” actually looks like a narrow gateway. This becomes clearer if you zoom in on the moon:

Figure 4: False color contours of the cislunar potential, close up near the moon.

If you want to get up and over by using the least amount of energy (and thereby the least amount of fuel) then you would want to go right through the center, following the yellow V  up to where the color turns just a little green and then turns back (down) to yellow.  This shows that it’s a rather narrow mountain pass, so maybe it’s better to describe it as a gateway.

It is tempting to try to identify the “gateway” point as the Earth/Moon  Lagrangian Point L1, but it’s not, although they are probably close.   At the L1 Lagrangian point the Earth’s gravity is just slightly stronger than the Moon’s, such that an object there would orbit the Earth with the same orbital period as the moon (and thus if left there would simply follow along  with the moon, sort of like flying in formation).   The whole analysis presented here neglects the fact that the moon is actually in motion around the Earth, and to the extent that we are ignoring that motion the mountain pass is essentially the L1 Lagrange point.  To really get it right we would want to add the “effective” potential for an orbiting object.

Visualized with  Contour Lines

One friend I showed this all to had a little trouble visualizing the idea with the false color map, because the colors can look like “bumps”.   So I also plotted the surface using just contour lines, with the following result:

Figure 5: Cislunar gravitational potential near the Moon, using contour lines.

I like how one of the contour lines, which starts out “downhill” from the moon, actually loops back behind the moon.   This representation is the closest to a topographic (“topo”) map, where contour lines show elevation (and thus also gravitational potential energy).

That figure just shows the moon, but when you back out a bit to show both the Earth and Moon it also helps cement the idea of  gravitational potential as elevation:

Figure 6: Cislunar potential of the Earth and Moon.

Derivation of the Gravitational Potential

For completeness, here is my derivation of the expressions used in the script for the gravitational potential.  To start, the gravitational potential (symbol V) is the gravitational potential energy (symbol U)  divided by the mass of the spacecraft.  Dividing by the mass of the spacecraft makes the result proportional to U but independent of m, and thus we can think of it as being a property of the space at that point, independent of what is there.   And to get the potential energy, just as with electricity, multiply the potential by the amount of “charge” (in this case mass) at that position: U=Vm.   Now we just need to compute V.

To get the gravitational potential energy we can start with the force between the Earth or Moon and the spacecraft, which is given by Newton’s Law of Gravitation:

where M is the mass of the planetary body, m is the mass of the space ship, d is the distance between the two (center to center) and GN is Newton’s constant of gravitation.  This is the magnitude of the force — the direction is of course attractive, through the centers of mass of both bodies.   If we integrate this, from the surface of the Earth up to the position of the space ship, we get the gravitational potential energy. Then, to get the potential we divide by the mass m of the spacecraft to get
This equation holds for both the Earth and the Moon (for different values of M), and we can simply add the two to get the total gravitational potential at any position.

The code I used to make the images is available as a github gist.

Notes

  1. The word “cislunar” means “between the moon”, while the word “translunar” means “from the Earth to the Moon”.  https://wikidiff.com/translunar/cislunar
  2. Since the potential is negative, I actually use the logarithm of the absolute value of the potential, and then put the minus sign back in for the downward direction
  3. the ‘prism’ colormap from matplotlib

Summer Solstice 2019 in Wooster Hall

Summer Solstice 2019 in Wooster Hall

As we have done in past years, a small group of those interested came to Wooster Hall to observe the skylight lights cross over the staircase at Solar Noon (at 12:58:16 EDT). This year the actual Solstice (at 11:54 EDT) was very close to the same time, which is not always the case. Raj Pandya, director of the John R. Kirk Planetarium, lead everyone there through the simple calculation of the highest angle of the sun that day.
I set up my network camera to make the following time-lapse video:

The reason we are all supposedly there is to watch the bars of light crossing the upper staircase, but it looks to me like people were more interested in everyone else. Which may be as it should be.

Vernal Equinox 2019

What a difference a year makes. Last year I made a time-lapse video of the Vernal equinox in Wooster Hall by standing next to a wall and taking a photo about once a minute for an hour. This year I have a much nicer video from a raspberry pi camera which captures an image every 5 seconds. Here is the result:


I’ll edit this post later to provide more information, but for now I’m posting it in the hopes that the video is useful for tonight’s event, which alas I will miss because I teach a lab during that time. Enjoy!

Added the next day…

Here are some of the details about how this video was created.  You can compare this to how I did it a year ago and see if you think I’ve made progress.

First, the images were all captured by a Raspberry Pi 2 with attached camera, driven by a Python script which is started at boot time (unless there is a mouse or keyboard plugged in to a USB port).    The camera simply takes an image every 5 seconds and saves it.   No further processing is done on the Pi.

Then I take the Pi back to my lab and plug in a monitor, keyboard, and mouse.  The only reason for the mouse is to inhibit starting the camera.   I zip up the images into a tarball and copy that to a memory stick, which I then take to the Mac in my office.

The Mac runs the free version of the software TLDF  (the name comes from “Time-Lapse De-Flicker”).    I drag the files into TLDF, check the box for “Blend” and set it to blend 3 frames, and press “Render”.   It does the rest, and produces an MP4 video.   That’s it.

It’s not as fun as writing my own Python script to do variable duration frames in an animated GIF, but I sure do like the results.


Wooster Hall Rooftop Mystery

Wooster Hall Rooftop Mystery

A few weeks ago I visited Wooster Hall with a time-lapse camera to try to see what happens to the light from the skylight over the main staircase at solar noon on the Winter Solstice.  I was a few days early, but even so, I think I uncovered the basic idea, which you can review in a previous blog post.

The result is that the four columns of light that appear at the bottom of the staircase on the equinoxes now appear on the slanted ceiling near the skylight, and don’t extend down any further.   Here’s a picture (click on it for a bigger view):

Wooster Hall skylight on 18 December 2018

But as you will notice, there appears to be something in the way, preventing the columns of light from extending all the way downward, especially on the left.    What could that be?  In the original post of the video I mused that perhaps there is something on the roof which is casting a shadow.   Looking at the roof from a nearby building I could see that there are vents on the roof that are near that skylight.   And after that post I heard from the building architect that those vents are necessary to remove smoke in the event of a fire. It’s doubtful they could be moved.  But from that viewpoint I wasn’t sure that these were actually in line with the skylight, and I’m still doubtful that they are the culprit.

Someone else suggested that I could see what is on the roof using Google Maps.  That turned out to be very helpful.  Here’s the view from directly above, with some added markings (click on the image for a bigger view):

Wooster Hall from above (Google Maps).

The skylight is circled in red, and the green line shows my line of sight from the Chemistry building to the Wooster roof.  As indicated by the compass needle at the right edge, vertical on this photo is North, and as you might expect the four openings in the skylight line up with North, rather than with the building.   You can also see the vents near the skylight, the sort-of round things that are to the right and below the skylight.   But note that they are NOT directly below (i.e. South of) the skylight.  This means that they cannot be blocking the light in the way seen in the videos!   Which is what I suspected when viewing them from the Chemistry building.

So what is blocking the light?   I’m going to guess that it’s the roof itself — actually a wall which is a part of the roof.  As you can see from the photo, the roof has several levels (it’s easier to see this from the side view from the other building).   The part of the roof where the skylight is located is higher than the roof farther to the south, and there is a wall dividing the two levels.    You can see this a little better if we zoom in (again, click on the picture to make it (somewhat) larger):

Wooster Hall from above, showing the wall south of the skylight.

The orange line shows the position of the wall, which I suspect is just high enough to block the lower part of the skylight when the sun is at its lowest in the sky, on the Winter Solstice.   If you go back to the picture of the skylight from the inside, it looks like whatever is casting the shadow is larger on the left and sloping down to the right.   But keep in mind that the building is turned away from North, and the skylight image is cast on a slanted ceiling/wall  (which might even be curved).  My guess is that the shadow is actually a horizontal line, caused by the wall on the roof.

And, by the way, if you don’t see that the orange line marks the position of a wall, then go to Google Maps yourself and find this building and select the “satellite” view.   The way Google presents the images they actually change your view slightly as you drag the map, giving a sense of 3D which shows more clearly that the roof has multiple levels.  It’s pretty cool that they can do this without your having to wear 3D glasses.

Is there anything we can do to unblock the sun?   Well, at least it’s not a vent that’s  required for fire safety, but the wall is probably necessary too.   Maybe a section of the wall could be replaced with an open railing  or chain-link fence which would still provide safety to whoever is working up there, but would let the light through to the entire skylight at the Winter Solstice. Or maybe not.

I still want to get up on the roof to try to confirm this conjecture.  By measuring the distance of the bottom of the skylight to the base of the wall, along with the height of the wall, I could determine the position of the shadow of the wall for a given elevation of the sun, and verify that the shadow would reach the skylight. And maybe figure out how much the wall would have to be lowered  (instead of completely removed).   This isn’t over yet,  so stay tuned…

Winter Solstice in Wooster Hall

Winter Solstice in Wooster Hall

Wooster Hall at SUNY New Paltz has a neat feature:  the main staircase is aligned directly North/South, and skylights are positioned above it so that at solar noon on the equinoxes the bottom of the staircase is illuminated by four columns of light which crawl slowly across the floor.   It’s an exciting event on campus, for some reason.   This past spring I made a crude time-lapse video of this.   Also, on the summer solstice, and again at solar noon, the upper part of the staircase is illuminated.   I made a much better time-lapse video this time, which includes a demonstration of the reason for the change in the sun’s elevation, where I’m assisted by my 9-year old daughter, Amanda.

But what about the Winter Solstice?   There are no markings on the staircase or nearby, and in any case the sun is so low in the sky in winter that it’s not clear that there would be anything to see.   But since I’m always curious about such things, I decided I had to find out.

The weather for December 21st was expected to be overcast and rainy, so I actually visited Wooster hall earlier in the week, on two different days.  First, on Tuesday, December 18th, I was able to get the general idea of what’s going on:

As you can see, the four columns of light from the skylights move across the wall directly below the skylight,  but they don’t extend further down.

It seemed like I had gotten there a little bit late, so I came back earlier the following day.   This time I think I got the whole thing:

There is a jump at the very beginning of the video, where I repositioned the camera.  Unfortunately, I moved the camera closer to some lights on the wall, and it looks like that changed the contrast of the video and made everything darker.  Even so, you can see the whole event as the sun crosses over.

Both of these time-lapse videos were created using a very nice piece of software called TLDF  (which  stands for “Time-Lapse-De-Flicker).  Actually, I just used the free “lite” version for Mac, called TLDFLITE, and that worked fine for this project.   You can find out more about it at https://timelapsedeflicker.com/

One thing that’s very obvious from both videos is that there are not four full bars of light, the way there are at the summer solstice and the equinoxes.  There is a curved shadow that blocks the light, mainly on the left side, curving down to the right.  It’s probably something on the roof near the skylight, but I don’t quite know what.  I went to the top floor of the nearby Chemistry building to get a view of the roof of Wooster Hall, and I can see that there are ventilation stacks near the skylight which might explain the shadow, but I wasn’t sure either of them lined up quite right.

So now I want to get up on the roof to see what is in the way, and  to see if perhaps it can be moved out of the way.   If I can’t get up on the roof, then perhaps I can find someone with a drone to help inspect that area.  Stay tuned….


Running a task at a specified time on a Mac

Unix computers have a simple command-line feature called “at” which lets you schedule a command, or a series of commands, to be run at a specific time.    For example, if you want to download a large file in the middle of the night, when there is less congestion on the network, you can easily do so.    Since the Apple Macintosh computer is based on BSD Unix, this feature is available on a Mac, though it is turned off by default.     I’ll use downloading a file as an example in what follows, but you can use this to run almost any command at a specified time.

As you might expect, everything here is done via the command line, which means you will have to run the Terminal app.   With the Finder it is in /Applications/Utilities, while using Launchpad you will find it in a folder called either “Other” or “Utilities”.

Starting atrun

The “at” service is provided by a Unix daemon called “atrun”, which is turned off by default on a Mac.   To turn it on you have to give the command1

 sudo launchctl load -w /System/Library/LaunchDaemons/com.apple.atrun.plist

You will need to do this again if you reboot, though there is a way (see Reference 1) to turn it on permanently.

Simple Example

Let’s test the system first. The command is simply “at” followed by a time or date (or both). So if it’s currently 10:00 AM, then the commmand  “at 1002”  will run the command(s) in 2 minutes.   Once you give this command the terminal will wait for your input.  Enter as many Unix commands as you like, one per line.  I’ll just demonstrate with the “echo” command.  When you are done, press Control-D (the Unix end of data character, often written in examples as “^D”).  When you do so, you’ll get a line telling you the job number and date and time it will run. Here’s an example (the parts in red are what I typed):

thrain:myers> date
Thu Aug 16 10:00:45 EDT 2018
thrain:myers> at 1002
echo "Hello, World!"
^D
job 8 at Thu Aug 16 10:02:00 2018

The command “atq” will show you the contents of the queue of commands waiting to be run.

thrain:myers> atq
8       Thu Aug 16 10:02:00 2018

The job is queued to run at 10:02. When I check on it at 10:03 I find:

thrain:myers> date
Thu Aug 16 10:03:48 EDT 2018
thrain:myers> atq
thrain:myers>

The lack of output means there is nothing in the queue. Where did it go? The output is sent to you using the Unix mail system. It won’t go to your gmail account, but you can easily get it using the local Unix “mail” command:

thrain:myers> mail
Mail version 8.1 6/6/93.  Type ? for help.
"/var/mail/myers": 1 message 1 new
>N  1 myers@thrain.local    Thu Aug 16 10:02  13/452   "Output from your job "
? 1
Message 1:
From myers@thrain.local  Thu Aug 16 10:02:07 2018
X-Original-To: myers
Delivered-To: myers@thrain.local
Subject: Output from your job a00008018639aa
Date: Thu, 16 Aug 2018 10:02:05 -0400 (EDT)
From: myers@thrain.local (Atrun Service)

Hello, World!

? q
Saved 1 message in mbox

Downloading a large file at a specified time

So how can we download a file? Another Unix utility, the “curl” command,2 will automatically transfer a file from a specified URL. I’m going to use it to download a 475MB file containing data from LIGO’s first detection of colliding black holes,3 which will come from https://losc.ligo.org/archive/data/O1_16KHZ/1126170624/L-L1_LOSC_16_V1-1126256640-4096.hdf5.

By default, curl will output whatever it downloads to “standard output,” which means it will spew out into the terminal window. To avoid that, and cause curl to save the data to a file of the same name, I will add the “-O” flag (that is a capital letter Oh). And as it turns out, that URL is not the real URL for the file, it leads to a redirect, so I will also include the “-L” flag to tell curl to follow the redirect. Finally, curl can be very verbose while it operates, to display download status. But for our purpose we just want it to work silently, so I’ll add the “-s” flag.

Also, I want to time how long this takes, so I’ll prefix the curl command with the Unix “time” command.

And I want to put this on my desktop. When you first open the Terminal app your default directory (“current working directory”) is your home directory, and your desktop is a subdirectory (folder) called “Desktop”. So I’ll use the Unix “cd” (“change directory”) command to go down into that subfolder first.

Here’s how I do all this:

thrain:myers> date
Thu Aug 16 11:14:51 EDT 2018
thrain:myers> at 1117
cd Desktop
time curl -O -L -s https://losc.ligo.org/archive/data/O1_16KHZ/1126170624/L-L1_LOSC_16_V1-1126256640-4096.hdf5
^D
job 15 at Thu Aug 16 11:17:00 2018

After a short wait I find the queue is empty, and the file is on my Desktop. But since it is a large file it actually takes several minutes for it to finish downloading, and only after that does the output show up in the Unix mail queue:

thrain:myers> mail
Mail version 8.1 6/6/93.  Type ? for help.
"/var/mail/myers": 1 message 1 new
>N  1 myers@thrain.local    Thu Aug 16 11:23  16/482   "Output from your job "
? 1
Message 1:
From myers@thrain.local  Thu Aug 16 11:23:07 2018
X-Original-To: myers
Delivered-To: myers@thrain.local
Subject: Output from your job a0000f018639f5
Date: Thu, 16 Aug 2018 11:23:07 -0400 (EDT)
From: myers@thrain.local (Atrun Service)


real    5m56.723s
user    0m24.240s
sys     0m7.400s

? q
Saved 1 message in mbox

As you can see, it took almost 6 minutes to download the file.

Learning more

You can learn more about any of these Unix commands by reading the Unix Manual pages, using the Unix “man” command. For example, saying “man curl” will tell you more about the curl command, and saying man time will tell you more about the Unix “time” command. Saying “man at” can help you understand how to use the relative time features of the at command, such as

  at now + 12 hours

References and Notes

  1. “Mac OS X: at command not working” on StackExchange site “superuser.com”, https://superuser.com/questions/43678/mac-os-x-at-command-not-working
  2. On some versions of Unix you can use the wget command, but this is not available on the Mac
  3. Data release for event GW150914, from the LIGO Open Science Center, https://losc.ligo.org/events/GW150914/

Summer Solstice in Wooster Hall

Summer Solstice in Wooster Hall

Wooster Hall at SUNY New Paltz has a neat feature.   The main staircase is exactly aligned along a north-south line, and skylight windows in the ceiling were placed so that light from those windows lines up at the bottom of the staircase at solar noon on the equinoxes.    In the summer the sun is higher, and so the light from the skylights lines up with the top stairs of the staircase.     It’s become an event on campus to come watch the lights slowly crawl over until they line up with the staircase.

The first time I watched this, last spring, I was inspired to create a time-lapse video; but without preparing ahead of time I ended up standing up against a wall for an hour, taking pictures every minute, and then later writing a Python script to assemble the frames into an animated GIF. The results can be found here, and the technical details are here.

For the subsequent Summer Solstice I was ready with both an iPhone set to time-lapse mode and a Raspberry Pi programmed to take pictures every 5 seconds. The result from the Raspberry Pi is now on YouTube (watch the stripes of sunlight on the top stairs, not the people):

Technical details of how the Raspberry Pi was configured may be shared later. Instead of trying to assemble the time-lapse video on the Raspberry Pi itself, this video was assembled using iMovie on an iMac.   (I tried to use software called TLDF, but it requires frame sizes of at least 800 pixels, and the frames captured for this video were 640×480.) The result was an mp4 video file instead of an animated GIF. Perhaps I’ll get to try TLDF at the fall equinox….

Vernal Equinox in Wooster Hall: Irregular Interval Time-Lapse Animation

Vernal Equinox in Wooster Hall: Irregular Interval Time-Lapse Animation

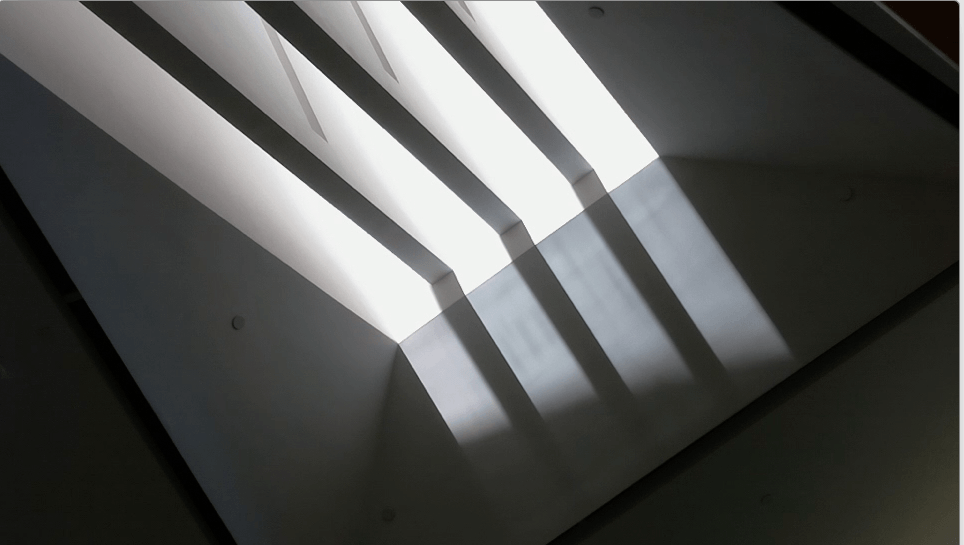
Wooster Hall on the SUNY New Paltz campus was completely remodeled recently, and a neat new feature is an alignment of the skylight over the main stairway such that the bottom of the stairs is lit up at exactly solar noon on the Equinox  (both spring and fall).

This spring when I observed this I was inspired, on the fly, to create a time-lapse video of the event, using just my hand-held phone.   You can see the video here.

Making the time-lapse video from the still images was a fun little exercise in Python programming, and the purpose of this post is to show how I did it.   I need to start out by saying that this is all really crude compared to what one can do now with time-lapse photography, but it was what I was able to do with little background or training, so I wanted to at least record what I learned.

One of the challenges to deal with is that the images were not captured at regular intervals, since I was taking them by hand with my phone.   I tried to space them out about every minute, but sometimes it took longer (like when someone was in the way) and sometimes I took them more frequently (as we got closer to solar noon).   Even so, I wanted to make the video flow as smoothly as possible by adjusting the time between frames accordingly.    That lead me to choose to make an animated GIF instead of some other format, because an Animated GIF can have different time delays for different images, whereas most video has a uniform spacing between frames.

My previous experience making an animated GIF was using the command line convert tool from Image Magick, but even that assumes a standard frame rate and does not make it easy to change the delays individually for different frames.   Still, I knew that the time of each image was recorded in the JPG file, so in principle I could use that to adjust the time between frames, if I read that information programatically.   That lead me to choose to write a Python script to do the job.   And then looking at what was available in Python, I chose to use PIL, the Python Image Library.

The way it works, overall, is that you read in all the images into a list, then save the first image as a GIF, and at the same time tell it to append all the other images, with an array of different time durations to show each image.   For animated GIFs the time to show each frame is in hundredths of a second, so I simply scale down the time interval between when the pictures were taken to an appropriate amount in hundredths of a second.

I also needed to do some processing for each image, before it was added to the animation.
Because I held the phone horizontally (landscape) but the JPG files default to “up” being portrait mode, I had to rotate each image by 90 degrees.   I also wanted to scale down the size of the image to make a smaller animated GIF appropriate for a web page, rather than a full sized video.

To get started I imported PIL and set up some empty arrays to hold the images, the durations (time between frames), and the names of the original image files.

from PIL import Image

images = []
durations = []
prev_time = datetime.now()

The current time is saved in prev_time to start the process of computing the time between successive photos. At this point I just needed a value which is both a ‘dateime’ object and somehow signals that it’s not a part of the sequence of times, which this does by being so much later than the first image.

Before reading in images, I needed an ordered list of the file names.  The file names are simply IMG_2921.JPG up to IMG_2821.JPG, in order.   I used the os module and made sure that the list was properly sorted:

import os

# Get a list of .JPG files
filenames = []

for file in os.listdir('.'):
    name, ext = os.path.splitext(file)
    # Only files, only .JPG files
    if os.path.isfile(file) and ext == ".JPG":
        filenames.append(file)
print "Found ", len(N), "image files.  "

filenames.sort()

With this list I was able to use PIL to read in each image file, rotate the image, resize the image, and then save the image in a list:

for file in filenames:
    img =  Image.open(file)
    rotimg = img.rotate(-90,expand=1)
    newsize = ( int(rotimg.size[0]/scale), int(rotimg.size[1]/scale) )
    frame = rotimg.resize(newsize)
    images.append(frame)

I set scale to 5.0 to reduce the size to 1/5 the original.

After saving each frame in the animation, I get the timestamp from the EXIF data in the original image, which just happens to be element 36867 of the EXIF property array. (You can look this up — I certainly had to). From this I computed the time duration for each frame, in hundredths of a second:

    # Duration of frame comes from actual time difference between photos

    exif = img._getexif()         # JPEG photo metadata (EXIF)
    datestamp = exif[36867]       # date/time the photo was taken
    img_time = datetime.strptime(datestamp,"%Y:%m:%d %H:%M:%S") # parse datestamp
    deltat = img_time - prev_time # difference as "timedelta" objects
    dt = deltat.total_seconds()   # difference in seconds (or fraction of)
    if dt < 0:                    # ignore the first one, it's bogus
        durations.append(dt*100.0/speedup) # GIF duration is in 100ths of second
    prev_time = img_time          # Save timestamp for next iteration

In Python, differences between ‘datetime’ objects are ‘timedelta’ objects1 and then we convert that to a float value in seconds, called dt, and rescale that to hundredths of a second. The scale factor speedup was set to a value of 30.0 to get a reasonable speed for the animation.

Notice that the duration of the frame is not saved for the first frame. That means that for the 99 images in the collection, there are only 98 durations (and of course they are all different). This turns out to be almost what is needed for the next step, putting all the frames together into the animation.

After this loop over all frames, the rotated and scaled images are in the list named images, the duration for each frame is in the list durations, and it’s time to put them all together. The way this is done is to write one frame image, and then tell PIL to append to it the list of the other images, with the list of durations.

print "Writing the movie..."
first = images.pop(0)
durations.append(100)     # pause 1 second at end of loop
print len(images), len(durations)
first.save("WoosterMovie.gif",save_all=True,
                              append_images=images,duration=durations,loop=47)

With 99 images in the list, the first is put into the variable first (and removed from the images list, which now has 98 elements. Meanwhile, I had to add another element to the end of the durations list, so now there are 99 durations. That makes some sense, because there are 99 images overall, but the mis-match between the length of the images list and the durations list was very confusing to me, and is probably the most important reason for writing this posting. Which is why I even printed the lengths to verify them when I finally got it figured out. But as you can see from the comment, it also means I could control the length of the pause at the end of the animation before it repeated. Also as you can see, you “save” the first image, and then pass the other images and durations as parameters, which seemed kinda weird at first, but that’s how the API works, so that’s how you do it. Hopefully this working example is useful to someone else, or at least to me in the future when I forget all this.

References

  1. Python Documentation, 8.1.4. datetime Objects https://docs.python.org/2/library/datetime.html#datetime-objects

Vernal Equinox in Wooster Hall

Vernal Equinox in Wooster Hall

The newly updated Wooster Hall has a neat feature at the bottom of the staircase between the first and second floors.  Above that stair  there is a large skylight with 4 windows, and at the bottom of the stairs there are markings on the floor that show where the shadows between those windows will be at solar noon on the Vernal Equinox (see the image above).

I was able to observe this phenomenon in some detail on Tuesday, 19 March 2018 (which was actually the day before the equinox, but the weather was expected to be cloudy the next day, and indeed it was). When I arrived I found a nice corner to observe from, and although I had not planned to do so ahead of time, I ended up taking a picture just about every minute (and more frequently right around solar noon) for an hour or so. After a little research I was able to write a Python script to put the images together in the following animated GIF  (keep your eyes on the shafts of sunlight moving across the floor):

The speed  is a little rough — I was aiming for one second of animation for one minute of real time but apparently I still need to make some adjustments, and even then it might depend on which browser you are using.

It was a little tricky to do this right, because I was not able to take the photos at regular intervals, and so the duration of each frame in the animation had to be computed from the time of the photo, which was extracted from the EXIF metadata. In case it is of some interest, the details of how I created this animations are in my next post: “Vernal Equinox in Wooster Hall: Irregular Interval Time-Lapse Animation

Skip to toolbar