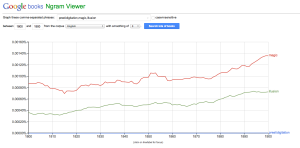
My first Google Ngram graph features my favorite word, “prestidigitation,” and other words that relate to it [“illusion” and “magic”] so that I could see which was the most popularly used. I tried 1800-2000 first, but changed it to 1800-1900 thinking that “prestidigitation” would appear more in older texts. Here is the result:
Sadly, I was wrong. “Prestidigitation” might as well be a made-up word as far as Google Books is concerned, and that is disappointing. “Magic” and “illusion” are much more frequently used. However, nothing exceptionally significant can be seen in this graph. “Magic” seems to have a very gradual upward trend, while “illusion” does the same, less frequently. Looking at this graph, it can’t be deciphered whether these words were used in metaphor, figure of speech, or as a subject in the book. Therefore, the words’ existence is the only notable information revealed with this graph.
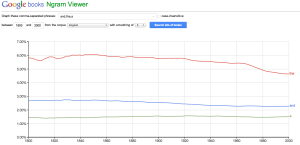
I can’t help wondering what “lots of books” Google is searching and how reliable this graph is as a source that can be shared with other curious readers. Is the Google Ngram function just an intriguing way to pass the time? What is the vertical axis even showing? If the word “magic” is only in 0.0013589726% of Google Books at it’s highest point on this graph, how can we gauge how many books are being searched for this data? Well, I’m not sure we can, given the next graph I made:
Out of curiosity, I plugged in the three most used words in the English language, expecting to see them all reach 100%, but they only went up to… just over 6%? What about the other 94% of books? I think this graph illustrates the number one problem with the Ngram Viewer: it does not tell you how to use or interpret the information depicted.
Overall, the concept of the Google Ngram Viewer is to see things at a very great distance, but the information shown is too general and vague to be reputable. One must be able to see/signify context to find reliable information. I think Ngrams in an interesting tool, but after reading the articles regarding the tools we use in a negative light, I can’t help but see the flaws all too clearly.

