Lauren Gao’s: Topic Modeling II

After performing last week’s topic modeling on all 56 Sherlock Holmes short stories, 10 out of the 100 topics generated from last week were put into Google’s Fusion Tables to check for trends in the 10 particular topics of our choice. I chose to mainly look at the time period from January 1892 to July 1893 being that it contained a high concentration of published Sherlock Holmes stories.

The first two topics I looked at and compared were,

Murder and Villains

Screenshot (56)

Continue reading

Topic Modeling Results

I first decided to compare the topics of “crime scene”, “writing”, and “crime solving”. In the beginning of the chart, writing spikes significantly in 1893. I wasn’t able to find any major reasons why this happened history wise, but when looking at the date of the publication, I found out that this came from The Adventure of the Reigate Squire. In this story, the main clue that Holmes and Watson find is a torn piece of paper found in the victim’s hand, which (SPOILER ALERT) turned out to be written by the murderers. Crime scene seems to fluctuate until it spikes in 1908. From then to around 1925, it seems to stay pretty constant. I noticed that crime solving seemed to be pretty steady with crime scene, and would increase/decrease at around the same times, which I thought was interesting.   Screen shot 2015-04-02 at 10.41.39 PM

The second set I decided to compare was “light” and “smoking”. I put these two topics together because I thought the words in the light category were words that would be used when lighting a cigar/cigarette. The main thing that I noticed in this chart is whenever one rises/decreases, the other does as well, which makes me think that my first assumption was correct. And when you look from around 1920 on, you can see that although they are at different levels, they increase and decrease in the same pattern.

Screen shot 2015-04-02 at 10.41.53 PM

The third set I compared was “time” and “physical description”. I thought that the two would have some things in common based off of physical descriptions over time. But after doing some research, I unfortunately wasn’t able to find much of anything that would tie these two categories together.

Screen shot 2015-04-02 at 10.42.05 PM

The last categories that I analyzed were “marriage”, “business”, and “travel”. A cool thing I found was when I noticed that business made a huge peak in 1904, and after doing a little research I found out that this was when the telegraph started becoming more popular in common society. I also found that the 1904 World’s Fair occurred during this time, which was a big time for business and introducing new products to the world. Travel peaked in 1908, and I found out that this was when Ford first began making the Model T, which was a widely popular car during this time.

Screen shot 2015-04-02 at 10.42.15 PM

Overall, I thought this assignment was interesting, but when it came to figuring out how these categories compared to things in history I didn’t find it very helpful. I thought the spikes in the charts would lead my research to significant things throughout history but most of the time I couldn’t find anything, which was a little disappointing.

Money detective security

The first graph I did was comparing the topics of Money, Security/Protection and Detective. The clearest spike is for Security/Protection in June of 1904, historically I could not find anything that was happening at this time to explain this. There was a war involving and other small conflicts but nothing that could directly be pinpointed.  I then turned to Sherlockian-Sherlock.com to see what exact story was published at this time and the story is “The Adventure of Three Students.” The topics of money and detective also spike around this time which would lead one to think that the story mentions all three of those topics.  There is a spike with both security and money at the same time which is September 1917, which is due to the publishing of the story “His Last Bow”

money room

This next graph surprised me a little. I wasn’t sure if there would be much of a relationship between the topics of money and room descriptions but surprisingly the two topics seem to move together along the graph in unison. Aside from money peaked around 1925 and room description does not they basically peak at the same times. One again I had trouble finding anything historical that explained this. They both peaked in 1904 and as I said earlier nothing too significant happened in 1904 that would affect these topics. There were some wars and what not but nothing related to rooms or money.  I once again looked at the Sherlock stories themselves using the same website. Money peaks in March 1904 but there were no Sherlock stories published during this month and room descriptions peaked during June which again is “The Adventure of the Three Students.”


relationship apperance face

This graph did not surprise as much because I assumed the topics of face/head and appearance would move together and I also figured that relationship was closely related to those two. The peaked of both relationships and face/head can be contributed to the story “The Adventure of the Stockbroker’s Clerk” The story is about brothers and talks about family resemblance with could attribute the face/head part and because it is about brothers discussing the family relations can account for the relationships topic.

time travel

This graph it was a little easier to find history to understand the peaks. There is a slight peak for time in September of 1908 and I believe this is because of information I found on semicolonblog.com that states that a German mathematician was the first person to ever define time as the fourth dimension in September of 1908. There is also a very noticeable peak in travel around 1908 and I believe there could be two reasons for this. According to inventors.com in 1908 Henry Ford improves the assembly lines for cars, and the Hydrofoil boat was invented. I was surprised that travel did peak in 1903 when the plane was invented but instead it actually had a low in that year.

Writing and Travel For this graph the travel peaks are obliviously the same as the last graph. I thought comparing the two would work because I thought that as travel improved writing especially letters may also improve since there was better transportation for sending of those letters and the two topics are not too far off in the graph.  I could not find a reason for writing peak when it did so it may once again relate to the Sherlock stories alone. I’m not too sure.

Overall, I found topic modeling and graphing to be a bit difficult and I feel that personally I was not able to see anything new about the stories or the topics because of the graphs. I think maybe in different situations topic modeling would be more useful but I had a tough time with it.


Topic Modeling Graphs : An Investigation

Welcome to my topic modeling project! Throughout my research as to find some trends for these three different graphs, I have come across some rather interesting finds. Much like a topic modeling project we had reviewed in class, I was really interested in the historical aspects that may have inspired Sir Arthur Conan Doyle to include certain topics within his many stories. Here we go!

Writing

Screen Shot 2015-04-02 at 8.48.46 PM
“Writing” topic model. Note: the blue line represents stationary/paper products

The first topic that I created was Writing, with three subcategories : Stationary/paper products, secret letters and sending mail.

If we look at the left-hand side of my graph, we can see that all three topics had a huge spike around 1903 – so that year was the one that I searched around for.

According to The New York Times’ archive named “On This Day,” in Sept. of 1903, a cartoon of a “major post office scandal” was published in Harper’s Weekly, exposing some violations that a prior story had touched upon in March of the same year of a corrupt post master in the United States. I’m not certain if this would have any effect on Doyle’s work being that he was in a different country, but news travels fast – especially about scandals.

Speaking of scandals, I found a rather interesting English scandal that relates to the topic with the highest peak – secret letters.

I stumbled upon an original Daily Mail UK article that provided “never before seen” photos of Edward VII’s mistress – a woman named Lillie Langtry. According to a caption underneath one of her photos, “Langtry was a regular in high society- and counted Oscar Wilde and Arthur Conan Doyle as close friends.” Ah, such a small detail to this particular article, but a huge win in terms of my topic model research! If he in fact was friends with this woman, I’m sure that her scandalous personal relationship with a married man was an inspiration for his writing, hence why “Secret Letters” would be the largest peak on this graph.
Here are the topics that were covered under my “Secret Letter” classification, for reference:

word men american message words english short picture affair change give single letters copy criminal figures meaning agony dancing hilton

Langtry was English, as well as Edward; they had an affair; and she eventually immigrated to America following their secret romance. Coincidence? (I hope not, because that is a pretty interesting find if I do say so myself!)

According to the article, “Langtry is rumoured to have been the inspiration for the character of Irene Adler in Arthur Conan Doyle’s Sherlock Holmes tale, A Scandal In Bohemia.”

Crime

Screen Shot 2015-04-02 at 8.49.38 PM
Crime topic model graph

Now, onto a rather complicated looking graph on crime! This graph is divided up into four different topics: homicide investigation, house fire/arson, stabbing and detective. There are about four different peaks on this graph between the end of 1903 and October of 1904 – and I was out to see if there were any reasons behind this, aside from the possibility of them peaking due to publication date. Here are my findings:

I wasn’t really even sure where to start with this, so I began with a general Google search of “1903 crime UK.” I then stumbled upon a WikiPedia page on gun control laws in the United Kingdom – one of which involved the pistol in 1903. From there, I left Wiki and searched “1903 Pistol Act UK” and found a VERY helpful resource page that may in fact show why there was a prevalence of crime, homicide and police activity around the time where a gun control law was placed into effect. Gun violence must have had to happened prior to that in order to instigate an act to control guns in the first place.

According to the Dunblane Resource sheet, the act required that each gun be registered and not be carried by a minor or felon. As we know, most criminals do not follow rules – so maybe this is why there’s an influx in all of the categories in my topic model.

Another huge, famous inspiration that we may also be able to connect to “homicide investigations” being the largest of all peaks in 1903, would be that “Jack the Ripper” was indicted and put to death on April 7, 1903.

Physical Descriptions

Screen Shot 2015-04-02 at 8.50.37 PM

After a bit of intense research on scandal and crime, we are brought to my final topic modeling graph of physical appearances. This was a bit softer topic where it was in turn a bit harder for me to find connections. The trends weren’t very in sync with one another. Apparel peaks high twice, around 1891-1892. This was the section of years that consisted of the collection “The Adventures of Sherlock Holmes,” officially published in 1892. Due to the sheer subject matter of the stories, I can make an inference that descriptions of people’s apparel spiked up here due, in fact, to the publishing of the stories themselves.

Well folks, there you have my take on topic modeling with graphs! Thanks for reading.

Topic Modeling trends – Using Google Fusion Tables

I have chosen abstract topics, which are not too related to History. Nonetheless, I have observed a thematic connection between them, so I divides them into 4 groups.

The related topics of each group show more appearance at the same time periods, suggesting that Arthur Conan Doyle was writing about related themes in each time. Especial concentrations can be seen between 1891-1893, and 1904-1905. After 1908, the release of stories had been constant till the 1920s.

Chart-1
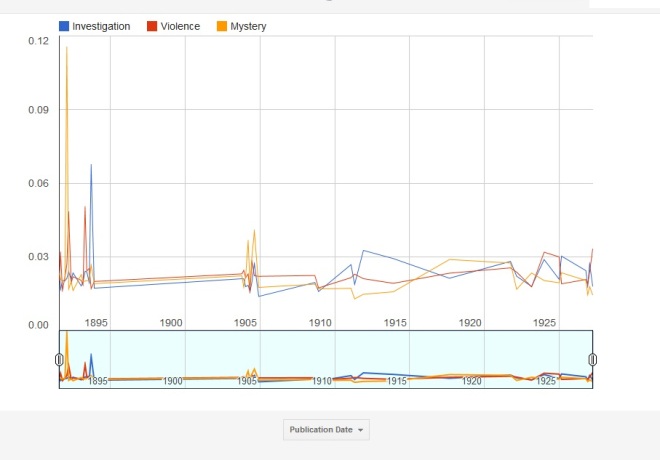
Chart 1: topics 4, 10 and 15 – Investigation, Mystery and Violence

In February 1892, we can see the greatest peak of the whole graph related to the topic “mystery”. This was the release date of The Speckled Band, a story full of words related to mystery, as our class well knows. The peak of “violence” (April 21, 1893), is the release date of The Gloria Scott, a story that ends with a death, which related words are within the “violence” topic. The peak of investigation (September 16, 1893) is related to the story The Greek Interpreter, which involves kidnapping and intimidation, which are material for “investigation”. “Mystery” seems to be the most important topic in the 1904 eight stories, as it stands out from the other topics.


Chart_2
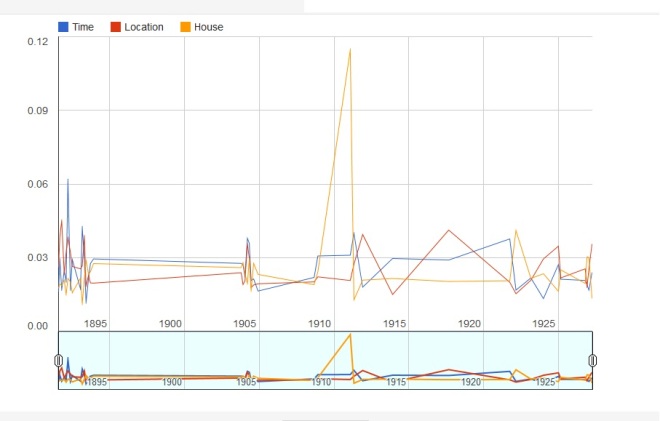
Chart 2: topics 14, 16, 26 – Time, Location, House

The greatest data here are the peaks of “Time”, in March 16, 1892 – release of The Adventure of the Engineer’s Thumb – and “House” in February 1, 1911 – release of “The Disappearance of Lady Frances Carfax”. The first, happens over the summer (time aspect), and the second involves a pursuit along housing environments.


Chart_3
Chart 3: topics 5, 8 and 29 – Conversation, Relationship and Appearance

The principal trends in this graph are a great peak of Relationship in September 1, 1891 (A case of Identity, a story about marriage and the relationship between stepdaugther-stepfather) and a growing appearance of “Conversation” matters in the stories between 1893 and 1903.


Chart_4
I have selected the topic 27 – Sitting – from my 40 topics to the list of the 10 favorite ones.

I have chosen to leave the most different topic one alone in the forth graph. It is “Sitting”, which includes words such as “chair sat room fire bell laid asked lit lamp”.

The first peak is related to the story The Boscombe Valley mystery (October 16, 1891), which involves traveling by train, carriage, driving, actions that might involve terms around “Sitting”. The second peak coincides with The Adventure of Wisteria Lodge (September, 1908), a story that happens inside a house (so it has related terms to “Sitting”).


All the charts in:

https://www.google.com/fusiontables/DataSource?docid=1ufgEjCptMHdlZwv27O3SJHmlyex_8CcmCwR3NSIe

Topic Modeling Graphs – Jen Pereira

The results of my topic modeling graphs were incredibly interesting to me. In my first analysis, I combined the topics of “crime,” “police work,” and “murder/death”. In this graph I found that, while the topic of police work tends to spike at random points throughout 1903-1904, crime and murder/death tends to be lower and typically the same throughout the two years in question. I did a bit of research and noticed that the two years graphed in this analysis were years of important sports events and a few protests. This would explain the spike in police activity without a correlating spike in crime.

Screen Shot 2015-04-02 at 11.09.29 AM
Crime vs. Police Work vs. Murder/Death

The second graph I charted was comparing the topics of travel and time. Travel appears to spike in a dramatic increase in 1908, with time spiking upwards as well during this time. I discovered through outside research that throughout the year of 1908 travel was becoming increasingly popular: the year beings with two expeditions around the world (one specifically from New Zealand to Antarctica); the Olympics were held in London in 1908 (which would increase travel to the area); and finally, the first aircraft manufacturing company in England is found in London. This would explain the increase in travel, as well as time.

Screen Shot 2015-04-02 at 11.28.31 AM
Travel vs. Time

Another set of topics I compared and contrasted were Business/Commerical and Construction. I noticed in my graphs that there was a correlating increase in both topics in 9125 and I wondered why that was. Looking at outside research, I noted that in 1925 there was a great deal of economic/commercial events taking place. For instance, primogeniture (or the rule that the first born son would inherit from the father) was abolished, Britain returned to the gold standard, the government granted a subsidy to the coal industry while they investigated its issues, the first double-decker buses with covered tops were introduced, and various bridges and tunnels were constructed. These events would clearly influence the Sherlock Holmes stories, as well as explain the increasing spike of these topics in 1925.

Screen Shot 2015-04-02 at 11.37.33 AM
Business/Commercial vs. Construction

Lastly, I decided to compare the topics of literature, description of clothing, and emotional verbs/actions. I thought that these topics were comparable as they all had to do with writing, and to an extent, education.I found the most interesting time period in this graph to look at was the years of 1891-1893. I found that literature often spiked dramatically first, and then the descriptive words would follow. One interesting fact that I discovered was that in 1891 Elementary Education was made free, allowing for an increase in literacy and education. This would, therefore, explain why the spikes were so dramatic around this time period. Futhermore, in 1892 Scottish universities began accepting women, and in 1893 the Brontë Society is established (the oldest literary society) and the Elementary Education Act raises the age to leave school to 11. All these historical events were significant in the rise of literacy and education, therefore explaining the rise of the topics of literature and the following descriptive words and actions.

Literature vs. Description of Clothing vs. Emotional Verbs/Actions


Topic Modeling: Graphing the Results

The first topic is Travel:

Screen Shot 2015-04-01 at 1.12.09 PM


In this graph, we see an increase in travel around 1893 and the only other spike that occurs is later on in 1904, but the 1904 spike is not as high as the spike in 1893, therefore, I decided to research why that might have happened.  I found out that by the end of the 19th century, they invented a new method of transportation.  Based on the website Primary Homework Help The Victorians , “In the 1890s they could travel by motor car.”  Based on the research, I think that people decided to travel more after the invention of the motor car which explains the spike in 1893.

The second and third topics are Writing with Business:

Screen Shot 2015-04-01 at 1.12.31 PM

In this graph, I decided to compare the topics writing and business.  These topics both seem to have a spike at about the same time; Writing in 1903 and Business in 1904.  Therefore, I decided to research this further to find out why this might be.  The amount of writing words appear the most in “The Adventure of the Three Students”.  After reading the plot on the Wikipedia article, there is a lot of writing going on in the story because of the fact that it deals with students and a university.  However, it does not explain why business words showed up often, therefore, I looked at another story that was published in 1904.  Based on the Wikipedia article, business words appear pretty frequently in the story “The Adventure of the Abbey Grange” because it talks about how a man has been killed by the Randall gang.  It is interesting why these words tend to rise and fall together; it helps us understand the stories better because it will explain that the stories’ topics will be about writing or business.

The fourth topic is Detective Case:

Screen Shot 2015-04-01 at 2.25.32 PM

In this graph, we see a spike, that is higher than the other peak, in detective cases around 1891.  Then, I decided to research why this spike happened when it did.  Based on the Wikipedia article about the Whitechapel Murders, “The Whitechapel murders were committed in or near the impoverished Whitechapel district in the East End of London between 3 April 1888 and 13 February 1891.”  Based on this research, It is possible that the Jack the Ripper case influenced the amount of detecting words in the Holmes stories in 1891.

The fifth topic is Death:

Screen Shot 2015-04-01 at 2.25.47 PM

In this graph, we see a spike around 1903 regarding death and there is no other spike like that one throughout the rest of the graph.  Based on the website The Guardian, “During the 1880s and 1890s, local authorities, the LCC and the Metropolitan Public Gardens, Boulevard and Playground Association began to clean up and reopen old burial sites.”  It is possible that the actions of these authorities influenced the amount of death words in the Holmes stories based on the fact that from 1893 onward there is a steady rise in the amount of death words.  However, after the researching, I still am not able to explain the sudden peak in 1903.

The sixth and seventh topics are Time with Crime:

Screen Shot 2015-04-02 at 10.55.17 AM

In this graph, we see a spike for both time and crime in the year 1904.  Based on my research in the Wikipedia article of the story “The Adventure of Charles Augustus Milverton”, which was published in 1904, it is about the crime of blackmailing.  It explains how in order to help solve the case, Holmes visits Milverton’s Hampstead house, disguised as a plumber, in order to learn the plan of the house and Milverton’s daily routine.”  Therefore, daily routine refers to time.  Even though, it is evident that crime and time words appear in every Sherlock Holmes story.

The eight and ninth topics are Physical Description with Building:

Screen Shot 2015-04-02 at 11.06.51 AM

I decided to pair these two topics together because I wanted to see if there is a correlation between the two and also because they are both descriptions.  Based on this graph, the amount of physical descriptive words and building words tend to rise and fall together.  Except in the year 1904, the amount of building words increases and the amount of physical description words is not as high.  Then, after 1905 they do the complete opposite of each other; when the amount of building words rise, the amount of psychical description words fall or vice versa.  It’s possible that this kind of correlation tells us  that either the story will have more building words or that the story will have more physical description words.

The tenth topic is Emotion:

Screen Shot 2015-04-02 at 11.19.53 AM

In this graph, we see that there is a spike in the following years where emotion words show up most frequently, 1893, 1904, 1913, and 1924.  I have come to the conclusion that the stories that were published in these years all contained woman characters, based on the Wikipedia articles, “The Adventure of the Cardboard Box”, “The Adventure of Charles Augustus Milverton”“The Adventure of the Sussex Vampire”, and the bubble news article.  Based on the fact that they all contained woman characters, It’s possible that the amount of emotion words increased during these times because in Victorian times women were not considered equal based on the Wikipedia article.  This helps us understand the stories better because we can connect them to how the past really was.

Topic Modeling Graph Results

I wasn’t sure how to label in Google Fusion tables(oops), but in my graphs the X axis represents the publication year and the Y axis represents theme frequency. Overall, I liked thinking about the graph results and musing over what the data might represent.

Gun: There was a large increase in this topic from December 1st 1893 to October 12th 1893. In 1893, The Final Problem was published. Although Holmes dies (insert massive question mark here) in the story, it isn’t gun related. He plummets to his death (insert another massive question mark here) at Reichenbach Falls with Moriarty. However, he is beaten with a police baton, so maybe my topic is faulty. The topic drops the next year, rises again in 1904, and then falls until 1911. After this, the graph experiences spikes in 1917, 1922, and 1925. I looked up guns in Victorian London using victorianlondon.org, and found an entry detailing a gun involved murder from 1876. Given the later dates, and presuming that I didn’t mess up to topic, maybe it’s that guns became more available, and recognized in crime stories.

Gun topic
Gun topic

Continue reading

Topic Modeling

Iterations: 1500

Topics: 20

Topics Printed: 20

  1. ESTATE: house road passed round side place walked carriage garden left master dog horse hall drive path led ground walk standing
  2. CRIME: man young found inspector house father colonel dead police heard death body attention son crime evidence murder returned dangerous hopkins
  3. PUBLIC: street found home back station train lord james baker minutes st occurred waiting reached cab hours police late order town
  4. SEARCH: thought time make give made leave knew great find back hear place things doubt bring chance lost position fellow danger
  5. EXPRESSION: cried face turned back hands instant hand suddenly head moment voice words sprang forward eyes fell appeared feet lips threw
  6. APPEARANCE: man eyes face black looked red dark white figure deep hair thin features hat heavy drawn tall appearance blue sharp
  7. REASONING: clear mind point reason question person find matter idea make means absolutely secret presence impossible save excellent aware explanation sign
  8. CASE: interest sherlock case facts strange remarkable friend singular account london cases arthur nature problem extraordinary details public effect give find
  9. SILENT REFLECTION: holmes chair sat gave mrs companion fire fresh visitor rose pipe easy start table glanced silence cold silent horror change
  10. BUSINESS: business london money men papers set office answered letters brother made hundred work address man considerable great company west mycroft

Sherlock Holmes’ Short Stories, Topic Modeling

For this project I started off with 5,000 iterations, 20 topics and 10 words printed, but I realized the words seemed to different or many repeated and I couldn’t easily put a topic on them. I tried a couple more times with less iterations more topics and more words and as I went down in iterations and up in topic and words I started to get ones that I liked. After trying numerous of different options I concluded with 2,500 iterations, 30 topics and 20 words, that made it easy to get a topic from.

Topics:

Murder

1.”found, left, lay, end, body, dead, path, ground, feet, death, foot, blood, ran, blow, knife, carried, water, lying, showed, mark”

Travel

 2.”house, road, station, place, train, reached, past, line, carriage, direction, drive, haul, walk, back, town, country, drove, dog, pulled, round”

House

3.”room, door, window, open, opened, bed, entered, floor, bedroom, key, heard, closed, sound, passage, inside, step, sitting, safe, light, rushed”

Description

4.”face, eyes, man, black, dark, white, red, spoke, hair, thin, drawn, tall, appearance, features, blue, deep, pale, sharp, mouth, middle”

Religion

5.” wife, told, life, knew, woman, heat, girl, god, secret, hands, speak, love, truth, child, married, sake, thing, mine, understand, loved”

Divorce

6.”lady, woman, Mrs., left, back, husband, bring, pour, brought, story, maid, heard, told, happened, creature, gentleman, beautiful, terrible, real, live”

Schedule

7.”morning, night, day, doctor, clock, hour, morrow, DR., news, hours, yesterday, days, evening, early, state, breakfast, telegram, return, late surprise”

Job

8.”London, business, money, time, man, years, office, Hopkins, hundred, twenty, company, pay, west, pounds, country, thirty, thousand, paid, city, advertisement”

Investigation

9.”police, inspector, found, house, crime, made, murder, night, attention, London, shot, tragedy, dead, remainde, reason, arrest, attempt, moment, official,charge.

Performance

10.”face, instant, moment, cried, eyes, voice, turned, suddenly, sprang, forward, through, hands, sat,air, cought, struck, quick, sudden, strange, dreadful”