Google Ngram Graphs

My first Google Ngram graph features my favorite word, “prestidigitation,” and other words that relate to it [“illusion” and “magic”] so that I could see which was the most popularly used.  I tried 1800-2000 first, but changed it to 1800-1900 thinking that “prestidigitation” would appear more in older texts.  Here is the result:

Screen Shot 2014-10-17 at 8.49.45 PM

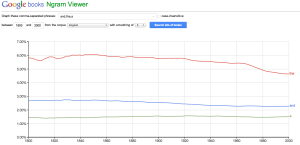
Sadly, I was wrong.  “Prestidigitation” might as well be a made-up word as far as Google Books is concerned, and that is disappointing.  “Magic” and “illusion” are much more frequently used.  However, nothing exceptionally significant can be seen in this graph.  “Magic” seems to have a very gradual upward trend, while “illusion” does the same, less frequently.  Looking at this graph, it can’t be deciphered whether these words were used in metaphor, figure of speech, or as a subject in the book.  Therefore, the words’ existence is the only notable information revealed with this graph.

I can’t help wondering what “lots of books” Google is searching and how reliable this graph is as a source that can be shared with other curious readers.  Is the Google Ngram function just an intriguing way to pass the time?  What is the vertical axis even showing?  If the word “magic” is only in 0.0013589726% of Google Books at it’s highest point on this graph, how can we gauge how many books are being searched for this data?  Well, I’m not sure we can, given the next graph I made:

Screen Shot 2014-10-17 at 9.25.38 PM

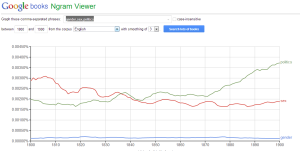
Out of curiosity, I plugged in the three most used words in the English language, expecting to see them all reach 100%, but they only went up to… just over 6%?  What about the other 94% of books?  I think this graph illustrates the number one problem with the Ngram Viewer: it does not tell you how to use or interpret the information depicted.

Overall, the concept of the Google Ngram Viewer is to see things at a very great distance, but the information shown is too general and vague to be reputable.  One must be able to see/signify context to find reliable information.  I think Ngrams in an interesting tool, but after reading the articles regarding the tools we use in a negative light, I can’t help but see the flaws all too clearly.
Google Ngram Viewer

Anthropology has an ugly, racist history. The earliest armchair anthropologists had a tendency to judge and write about other cultures based solely on their own morality and philosophy. The term ‘armchair anthropology’ stems from that idea. People were not actively studying other cultures in the field but rather creating prejudices against them from their imaginations. My strong interest in anthropology and curiosity of early anthropologists’ perceptions of other cultures inspired me to search the words “primitive, culture, and evolution”. The term ‘primitive’ was often used in a negative connotation by early anthropologists to describe “inferior” cultures. Evolutionary theory was a controversial idea in the late 1800s when it gained media coverage. The graph below shows the correlation between these concepts from the span of years 1800-1900.

graph1

The term ‘primitive’ was a term that appeared often in early Victorian literature. Many people viewed other cultures and societies and being primitive and below their own culture. Evolution is not a widespread concept until the late 1800s when Darwin reveals his own version of natural selection. From that point forward it rapidly increased in publications. Culture is another term that occurs more frequently in texts with the progression of time. It was interesting to see the small drop from 1800 to about 1825 in regards to culture in literature. ‘Culture’ and ‘primitive’ cross paths around 1870 which is near the time when early anthropologist Edward B. Tylor published, “Primitive Culture”. Tylor’s definition of culture is one of the most recognized contributions to anthropology:

“Culture, or civilization, taken in its broad, ethnographic sense, is that complex whole which includes knowledge, belief, art, morals, law, custom, and any other capabilities and habits acquired by man as a member of society.” —Tylor

My second Ngram was more of an experiment just for fun. I was playing around with different terms when I decided to search “love, sex, and desire”. I have always been interested in the way that these terms were discussed in Victorian-era literature. Many classic canonical works are from this time period and focus their plot around love and desire. It was to my understanding that sex was not something necessarily acceptable to talk about casually in public or in literature. The graph below shows the frequency of these three terms in literature from 1800-1900.

graph2

Love appears to be a very popular term used in literature of this time period. This was something I anticipated with my own knowledge of Victorian literature. The various dips and curves in the frequency throughout the years struck me as interesting. I wonder what contextual factors led to a decline or rise in the discussion of love. Desire is a term I often associate with love which is why I included it. I was intrigued by how frequent it actually occurred throughout the century. Even though sex was not bluntly talked about in texts, desire and lust may have been more socially appropriate or acceptable terms to describe sexual feelings. The Google Ngram platform is an amazing tool to perform distant reading. It allows one to search using several filters to toggle what they wish to examine. Although it does not give you context, which is a criticism that Underwood talks about in his article, it does provide you with a general understanding of a certain topic, theme, or author that can be analyzed in a multitude of lenses.

Google Ngram

I used the Branch Collective website to choose words that I thought may show interesting correlations regarding their presence in texts throughout the nineteenth century. For my first Ngram, I looked at evolution and ethics. For my second Ngram, I looked at imperialism and nationalism.

Screen shot 2014-10-17 at 2.03.12 PM

Screen shot 2014-10-17 at 2.05.54 PM

The first chart (evolution and ethics) shows an increase in the use of both evolution and ethics later in the century, around 1870. This makes a lot of sense because Charles Darwin began to publish his theories around this time, and there was a lot of talk and controversy surrounding evolution. Many debates on evolution took place around this time, such as the 1860 meeting of the British Association for the Advancement of Science in Oxford. Ethics played a large role in debates surrounding evolution and God.

The second chart (imperialism and nationalism) shows an increase in both words during the second half of the century, with a huge spike in “imperialism” at the tail end, closest to 1900. This makes a lot of sense because the Second Boer War started in 1899 and was marked by an increase in feelings of nationalism and the “New Imperialism,” along with racism and genocidal thinking. This was part of the “Scramble for Africa” among European nations.

(source: Branch Collective Topic Clusters – http://www.branchcollective.org)

Google Ngram Viewer is very helpful in locating trends within literature of digitized books from specific time periods. However, as noted in the blog post by Ted Underwood, there is a lack of context which can lead to misinterpretation or misinformation. That is why websites like Branch Collective can be helpful in understanding these correlations and trends.

19th Century Word Graphs: Thames/Hudson, trains/cars


Screen Shot 2014-10-17 at 10.27.12 AM


For my first graph, I decided to explore the progression of the words trains and cars in the 18th century. Train seems to be the more prominent word throughout the 19th century. This can be explained by considering this was still one of the most important means of transportation, people relied on trains to get to work, the country side, and the shipping of cargo. For most of the 19th century, cars were very expensive and only driven by the wealthy;therefore, they for the most part stayed out of literature since it was not a means of transportation known to most. Towards the last decade of the 1800s, cars does become a more popular word, most likely because cars were becoming more affordable and available to the public.

Screen Shot 2014-10-17 at 10.27.24 AM

For my second graph, I wanted to see if there was any noticeable correlation between the words Thames as in the River in England, and Hudson as in the river right next door to usFor the first quarter of the century Thames was definitely the more prominent word because all of England was dependent on the river for transportation and industry built up along the river as England with through their industrial revolution– people came to the river looking for work and boats were constantly passing through this famous river.  However, the Hudson soon became the much more popular word once 1830 hit. This can definitely be explained by the reasoning of more immigrants were coming to America and settling in New York down the Hudson because of all the factories jobs offered there. The Hudson took over the Thames’ thunder.

Google Ngram!

For my Google Ngram graph, I searched popular characters in Victorian -Era novels. I used Jane Eyre (Jane Eyre) , Sherlock Holmes (The Adventures of Sherlock Holmes) , and Pip (Great Expectations). When I searched these characters on Google Ngram Viewer between the years of 1800- 1900, these are the results I got:

Screen Shot 2014-10-17 at 10.29.52 AM

These are not bad results, however, since Sherlock Holmes was not written into existence until 1887, the results are not as good as they could be. To solve this problem, I changed the years to 1800-2000. This graph was more pleasing, as it gave me more results and a broader idea of the popularity of these characters. This is the graph I got when I changed the years to 1800- 2000:

Screen Shot 2014-10-17 at 10.30.10 AM

This graph shows that, for the most part, Pip is more popular than both Jane Eyre and Sherlock Holmes. Jane Eyre is more popular between the years of 1850 and 1863 and for a brief time between the years of 1887 and 1892. Jane Eyre peaked in popularity on this graph in 1857. This is before Sherlock Holmes was written and one of the two times in which this character was more popular than Pip. Sherlock Holmes was more popular than Pip only once, between the years of 1927 and 1938. Sherlock Holmes peaked in popularity 1933. At this point in time, Sherlock Holmes was more popular than both Jane Eyre and Pip.  Pip has great spikes in popularity a few times on this graph. One example of these spikes is from 1911 to 1921. The next spike is in 1987. This year is the peak of Pip’s popularity on this graph. Overall, between the years of 1880 and 2000 Pip was more popular than both Jane Eyre and Sherlock Holmes.

Google Ngrams

Ngram 1- Gender, sex, politics

ngram1

Ngram 2- Race, homosexuality, evolution

ngram3

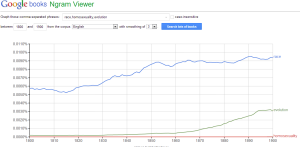
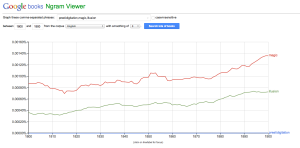
Referencing the Branch Collective website, I chose these terms after looking at their topic clusters page. I mostly focused on their identity section, pulling words such as gender, sex, race, homosexuality. I added politics and evolution because I thought it seemed relevant, given that talking about gender and sex is often taken into a political context, and since they are fairly controversial topics I also added in evolution. As you can see from these Ngram charts, as I expected, gender and homosexuality are barely mentioned in literature during this time period. Also evolution was very low on the chart until about 1870 which makes sense because it was around that time Darwin started publishing his theories. I find it interesting that during the early 1800’s sex was mentioned more than politics, and then in the 1830’s they switch. Clearly politics became more important/popular to write about than sex. Race is mentioned pretty heavily all throughout this period and is on the incline. As time goes on, especially in literature today, I would expect almost all of these words to increase.

Google Ngram definitely helps to see trends in literature during specific time periods, but as the blog post by Ted Underwood explains, it really doesn’t give much context. Although we know that race was talked about frequently during this time period, we have no idea how it was being talked about. Similarly with the word sex. Was it so high because Google books has a lot of erotic novels from this time period? We have no idea what type of books they are taking from to make these charts.

I do like the visualization aspect about these charts, but once again this information can’t stand alone and we need to look further to find more context for the words.