My Google Fusion tables assignment is based off of 10 different dog breeds. I researched their origin locations and average weights to construct my visuals.
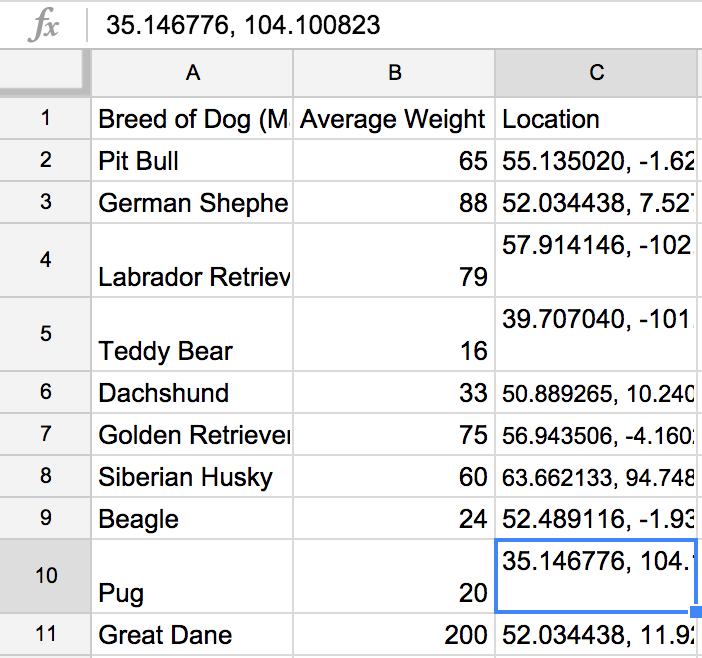
Here is my spreadsheet.
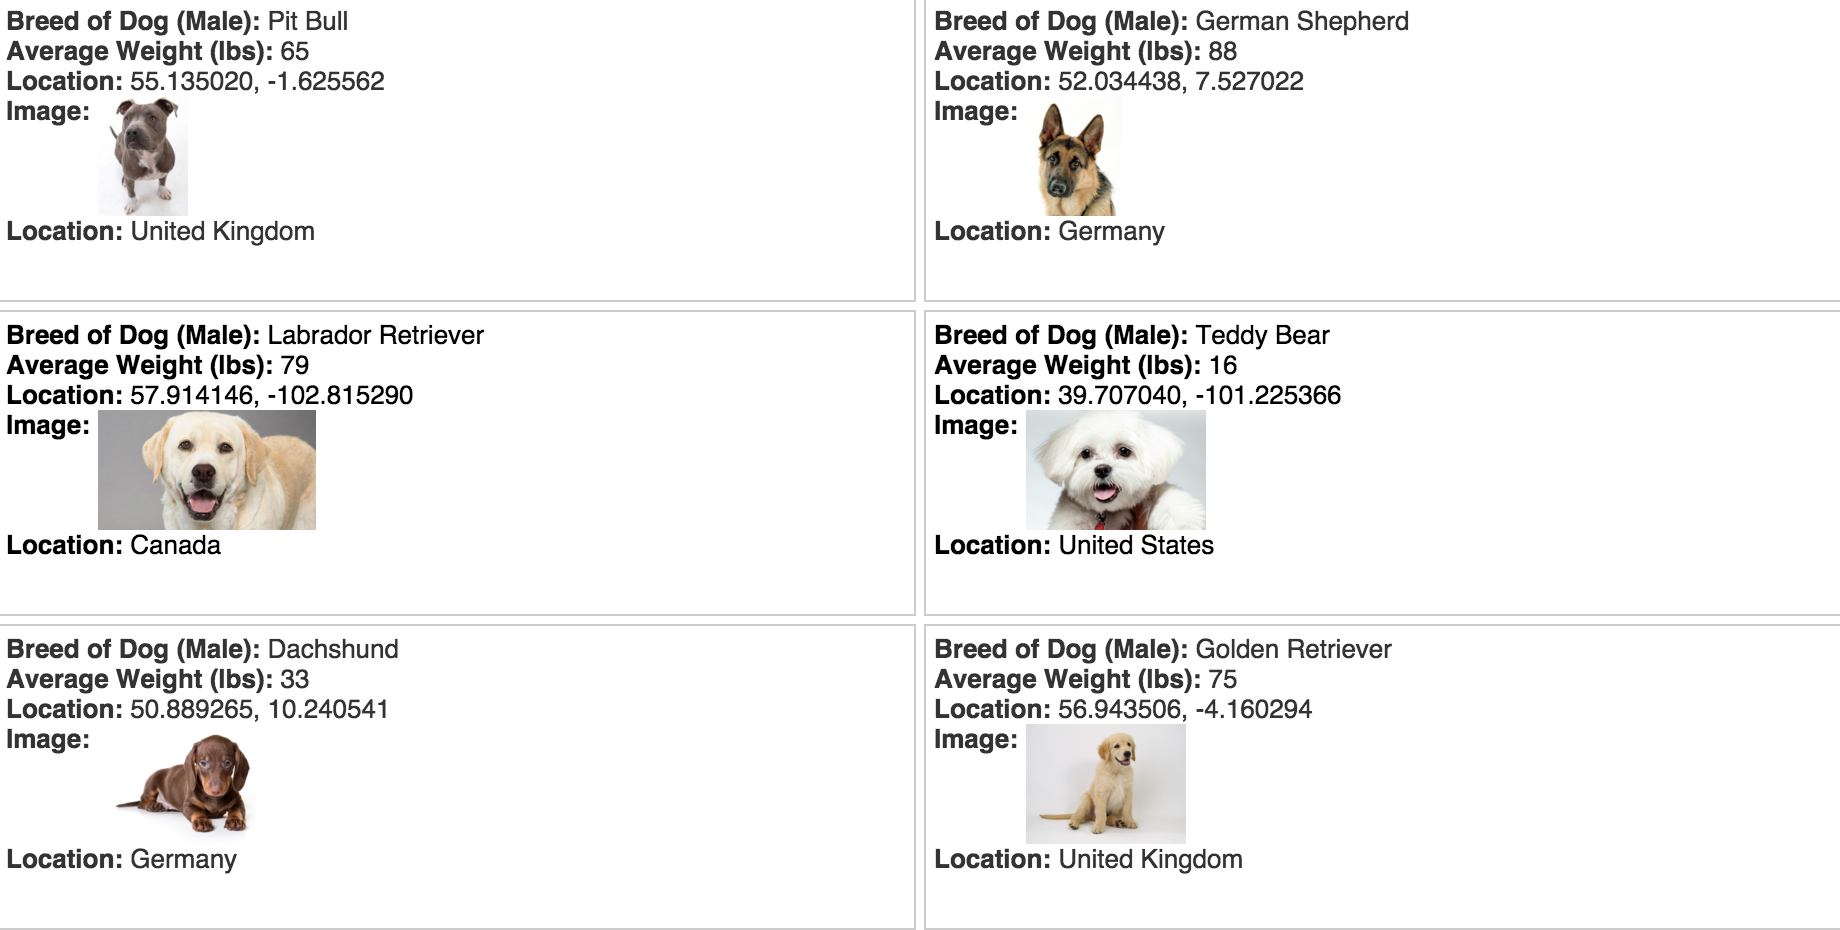
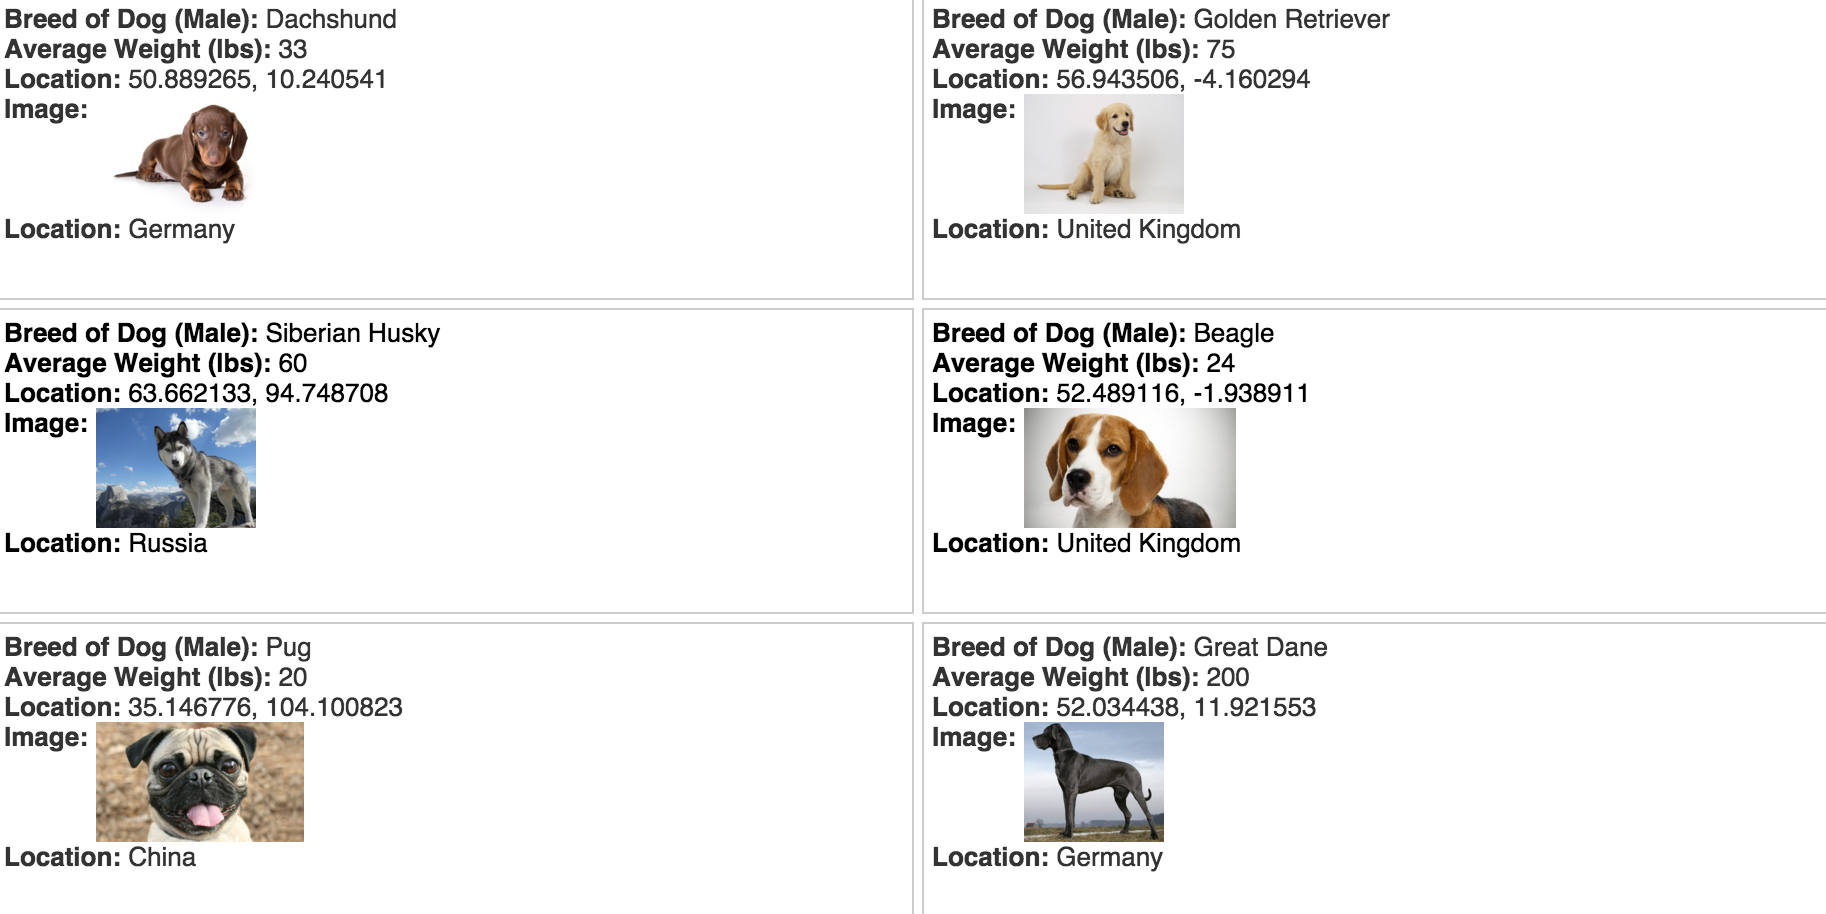
My Cards.
The map of where the dog breeds originate.

This is my bar graph. It is showing the relationship between breed and average weight (lbs).

My pie graph shows the amount of dog breeds in an origin location.

My network visualization connects the breeds to their location. In order to do this, I had to create another “location” column as a text based column. As you can see, Germany and the United Kingdom are the most popular origins.
