
Poughkeepsie’s Arterial Highways
In the annual City of Poughkeepsie State of the City address Mayor Rob Rolison called for unity in order to overcome the city’s current woes. This got me thinking about the many ways that the City of Poughkeepsie is divided. There are the obvious political divides, and the divisions between the people who work in Poughkeepsie and those who live there, as well as innumerable other issues that separate its people, but the city has been literally divided by its built environment – more specifically, its highways. One, the Route 9 arterial, built in 1966 divides the city from its waterfront. The other, the east – west arterial, completed in 1979 makes an island of the city’s central business district, and deepened the economic and social divide between the north side and the south side.
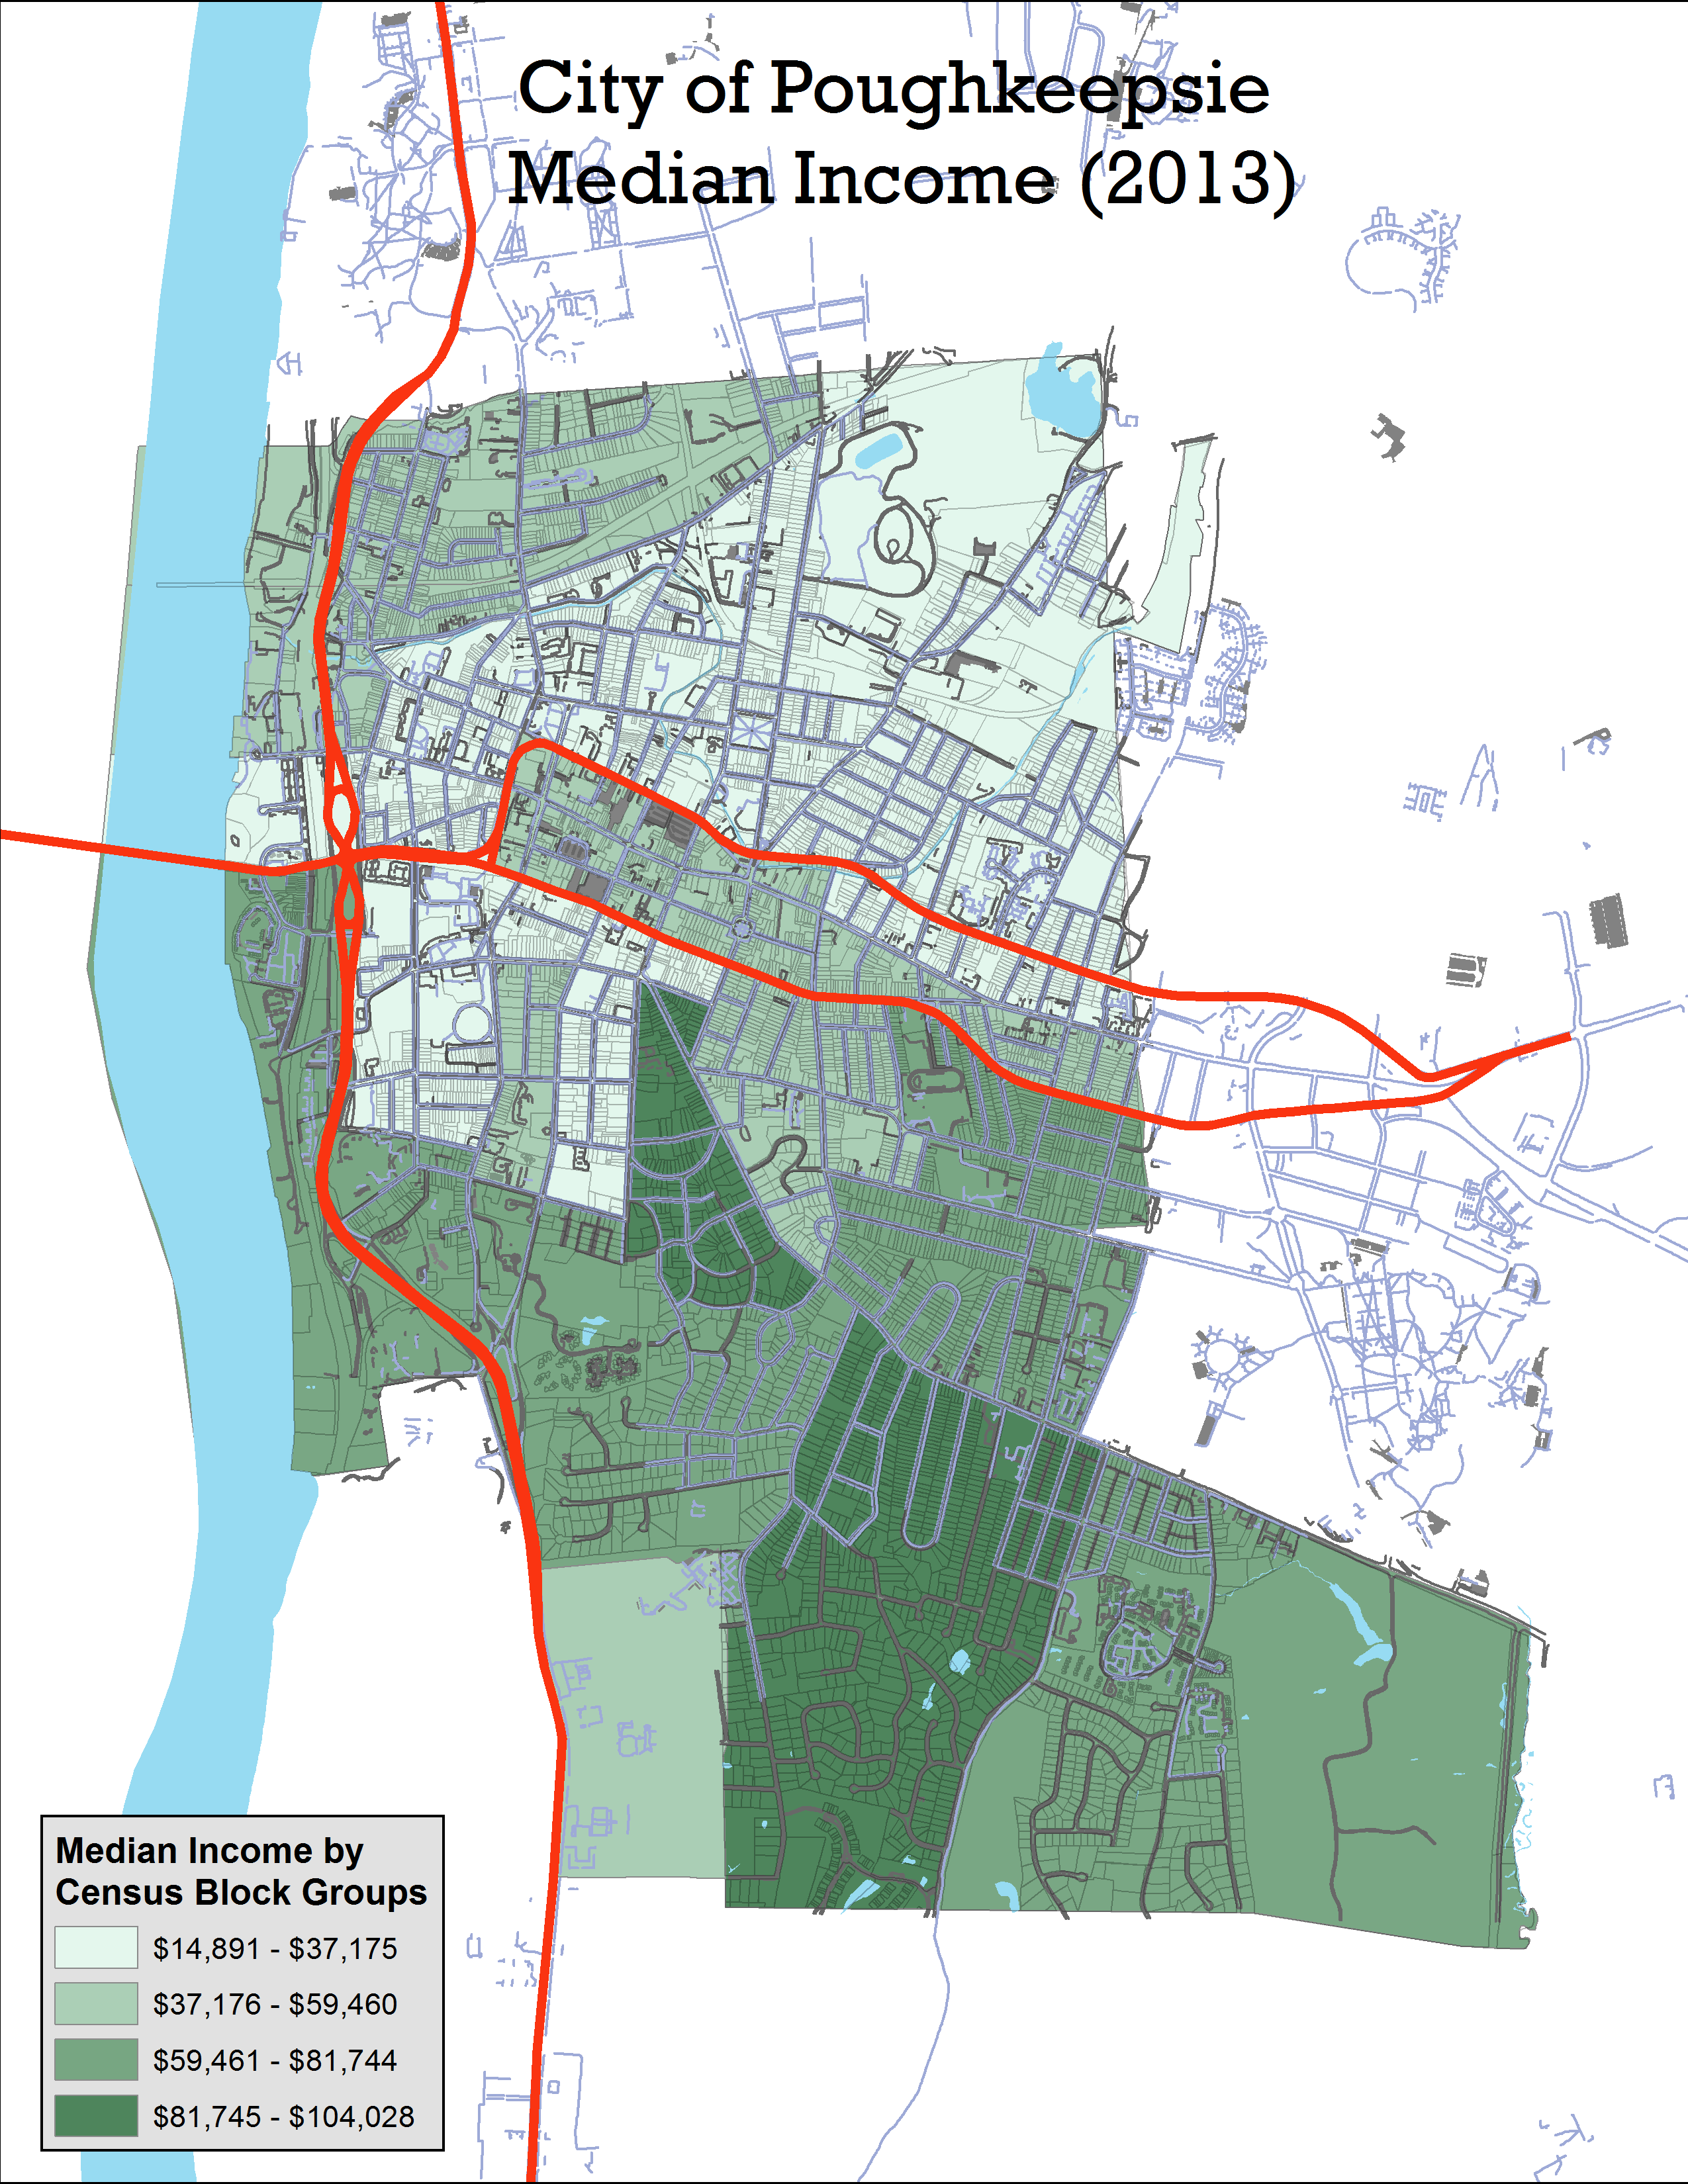 It is striking how the physical barriers of the highways conform so closely to how the city is divided racially, ethnically, and economically. The map below shows the median household income (2010) by census block. Predictably, the areas north of the east – west arterial have lower median incomes than those in the island created by the arterial, and those median incomes are even lower than the areas south of the arterial. The Route 9 arterial south of the bridge serves as a wall, creating a stark contrast in income between the apartments and condominiums along the river, and the low income neighborhoods just on the other side of the highway. Historically the south side of the city has always been more affluent than the north side, but looking at how closely the differences in income conform to the highway system, it is hard not to conclude that the highways exacerbate this.
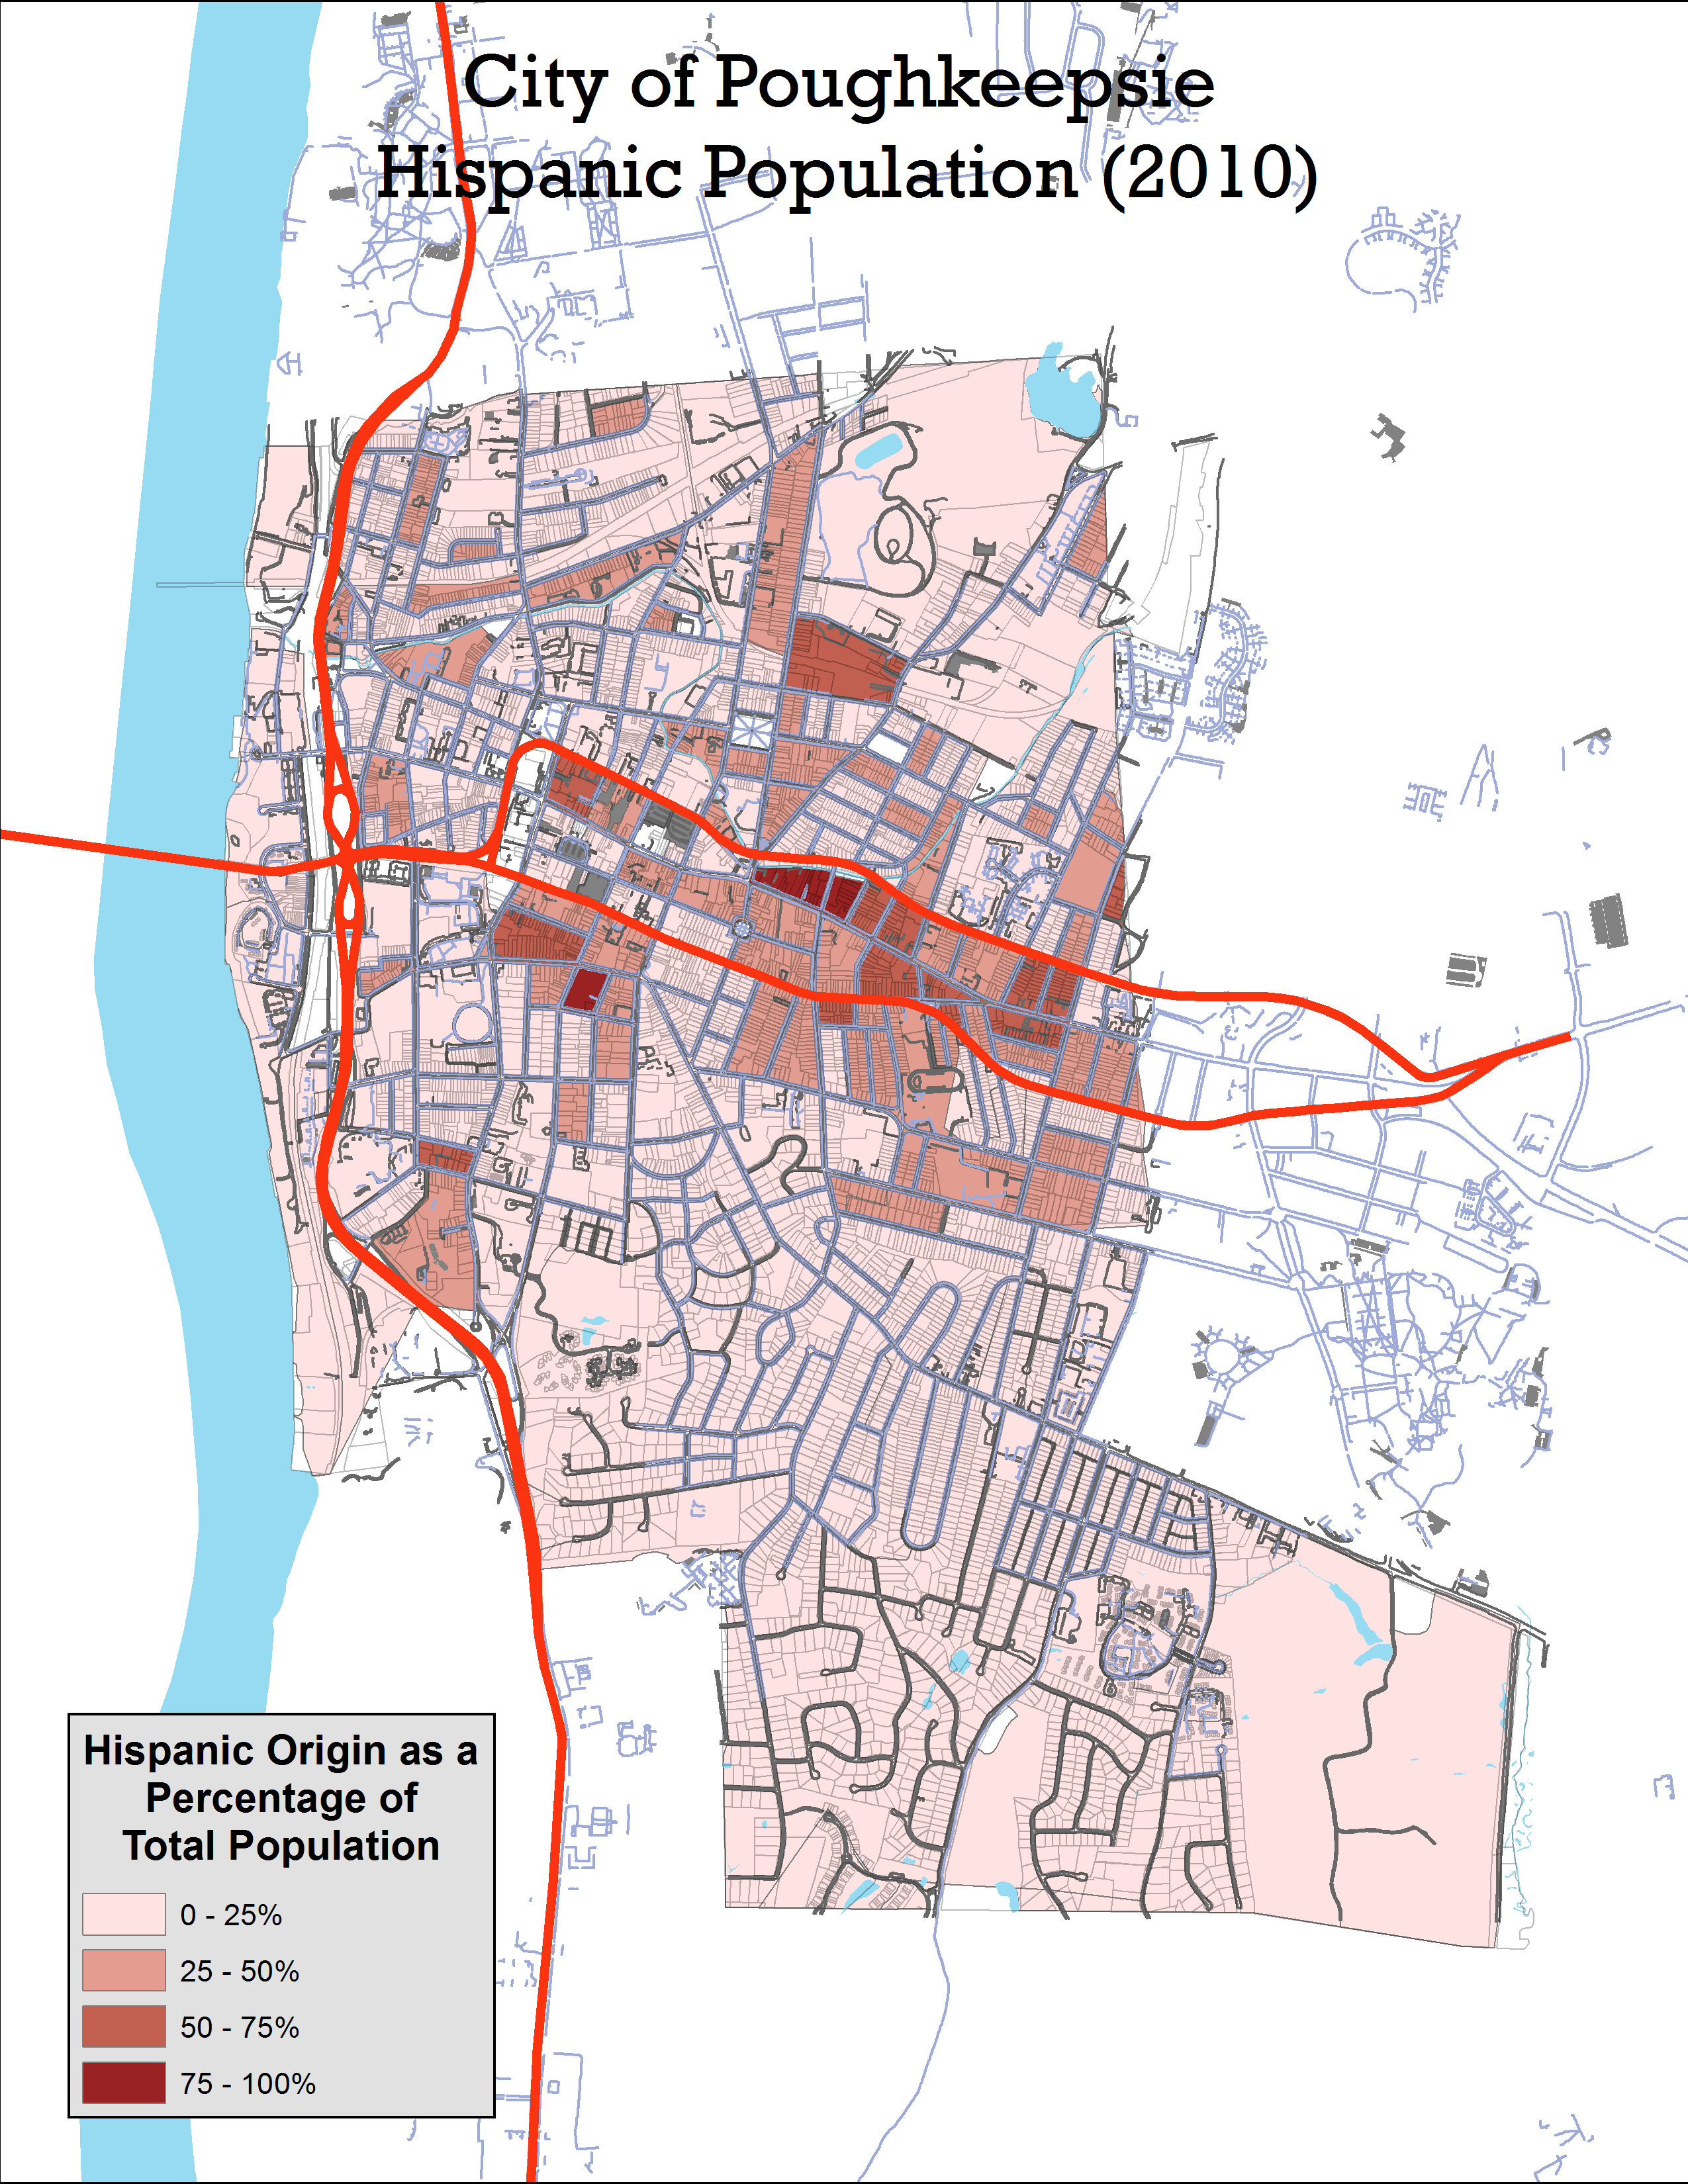 It should be no surprise then that the racial and ethnic divisions within the city follow the same pattern. The next three maps show the Hispanic, African American, and White populations as percentages of the total population (2010) by census block. The core of the Hispanic population of the city is located within the island created by the east-west arterial. This is an area of population growth, and while the U.S. Census 2015 American Community Survey estimates that since 2010 the population of the city has declined by 2000 people, they also estimate that the Hispanic population of the city has increased by 1000 people.
 The African American population of the city is concentrated on the north side of the city, and the cutoff at the west-bound arterial is sharp. The other predominantly African American population is in the neighborhood north and north-west of Eastman Park where the Harriet Tubman Apartments and Eastman Tower are.
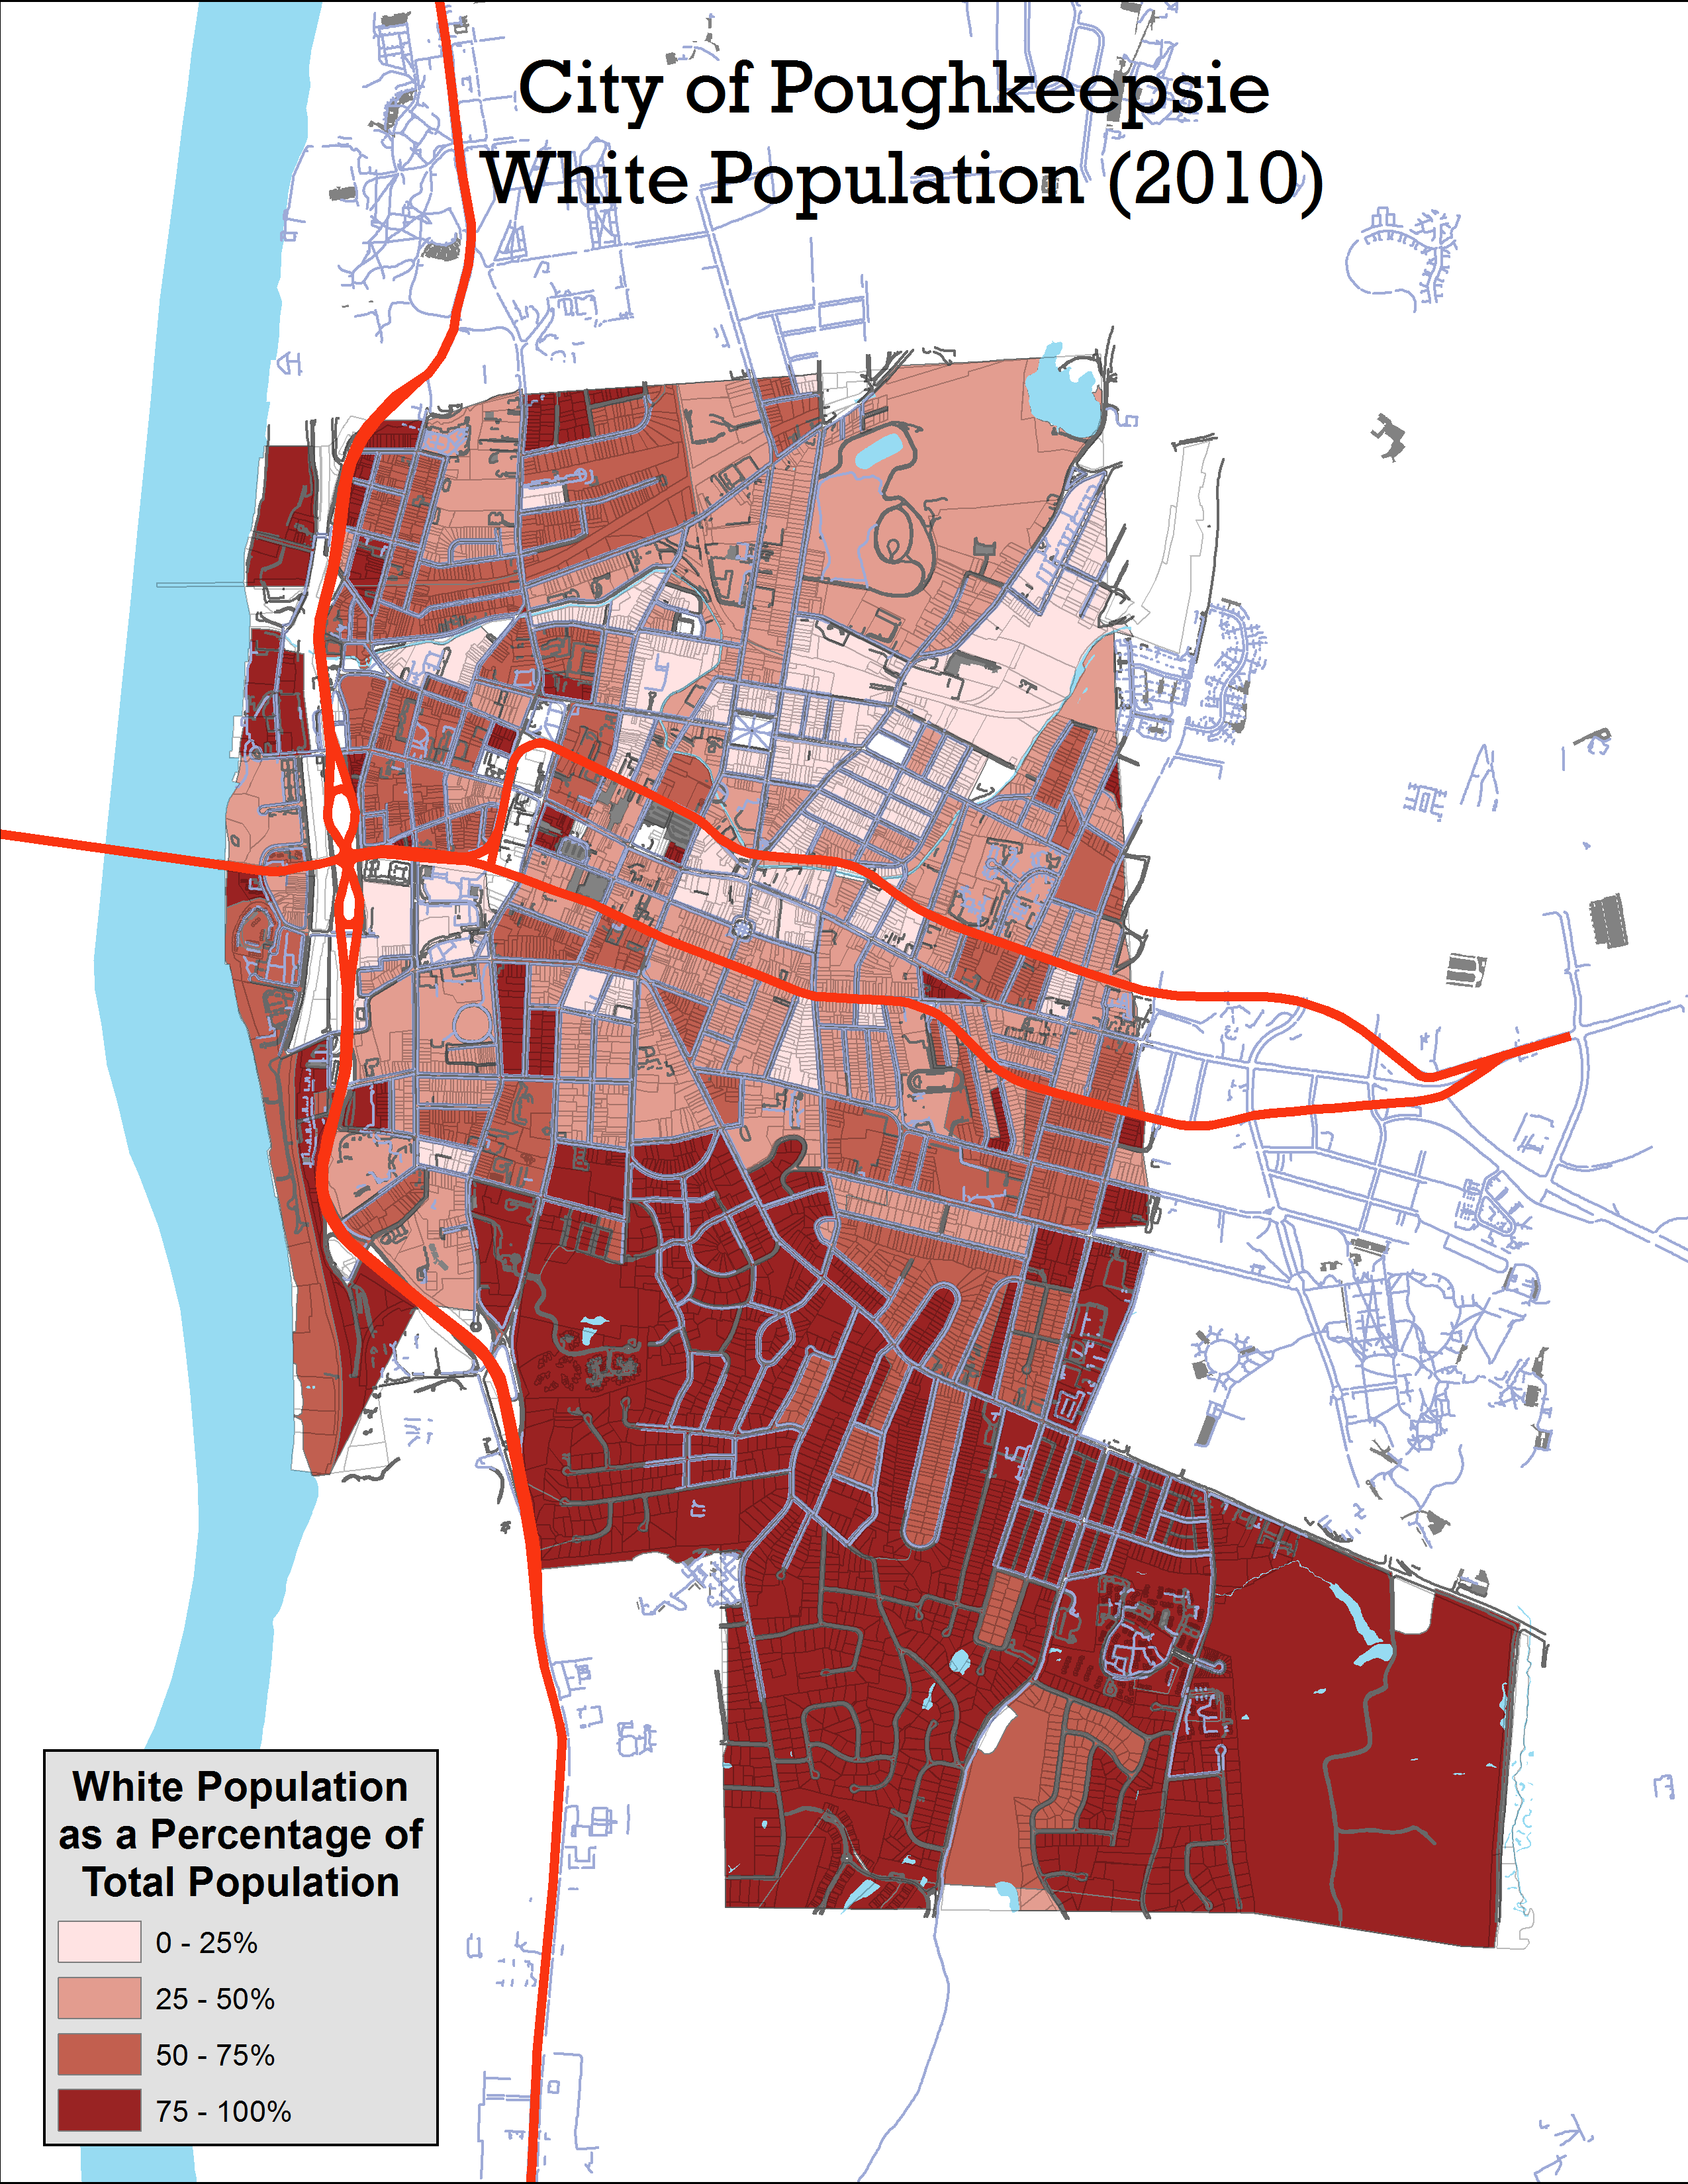 It is no surprise that the south side of the city is predominantly White. Historically this section of the city has been more affluent, and the southeastern section of the city that today makes up the 8th Ward was not annexed into the city until 1933. What is clear though is how sharply the city is divided along racial, ethnic, and economic lines.
When city leaders think about unifying to overcome the issues that Poughkeepsie faces, it may be helpful to consider the ways that it is divided, and what drives those divisions.
August 15, 2017 at 11:36 am
Joshua, I will be using some of your maps in a presentation I will be doing tomorrow evening on “The Warmth of Other Suns.” Isabel Wilkerson’s story of the great migration from 1915 to 1970 when 6 million African Americans moved from the south to the north and west. It will be st the Mid-Hudson Heritage Center.
February 2, 2022 at 1:43 pm
This looks very interesting. I have two questions for you: A) How have the maps changed based on the 2020 census? B) Could you please insert the school district boundary lines? You’re 100% right about the divisions and socioeconomic prospects posed by city panning. This can also shown through school district maps.
February 2, 2022 at 1:55 pm
A) When I get a chance, I will plug in the new 2020 numbers for the racial and ethnic maps to see what, if anything, has changed. I know that the Latino population of the city has increased as a percentage of the overall population, and that the White population has decreased. In general, I suspect that little has changed with regards to how the physical geography reinforces demographic and socio-economic divides.
B) The school district is contiguous with the City, so the City line is also the school district line.