https://www.google.com/fusiontables/DataSource?docid=1jNGQNPrwU-j8oWzP-gU5fKlYIC9CWThhZDruIx29
Google Spreadsheet Info
Cards
map locations of videos
Pie graph
Bar graph
Donut graph
https://www.google.com/fusiontables/DataSource?docid=1jNGQNPrwU-j8oWzP-gU5fKlYIC9CWThhZDruIx29
Google Spreadsheet Info
Cards
map locations of videos
Pie graph
Bar graph
Donut graph
Go and check out my introduction video!!
A good DH project must presents some features, as we have discussed through this course. I have selected five from these important qualities:
1) Built in collaboration
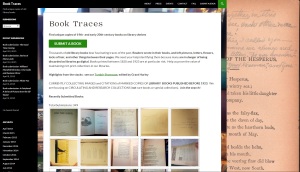
A good DH project is “open-ended”, which means, a lot of scholars or regular people can contribute adding material. Book Traces is a good example. You can easily submit a 19th century book, which contains something on its “marginalia” or objects inside. It is interesting because it is a collective effort to preserve endangered books, which can be discarded by libraries or disintegrated by the time.
This feature makes the project more effective, because its resources can grow in number and quality faster, as a lot of people are helping.
Collaboration also allows scholars to publish their work before finishing it, so they can get feedback from the audience, from other scholars and, then, improve their work. These “work in progress” was really difficult when the projects were paper-based.
2) Be Scholarly developed and oriented to scholars
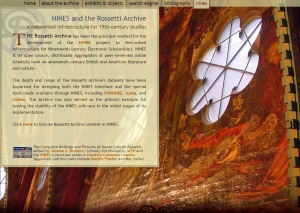
Being a scholarly project means that it has been built based on reliable sources and that the project cites those sources properly. Projects which are developed by Universities or Research Institutes are scholarly. However, everyone can build a scholarly project, if he/she is concerned where he/she gets the data and how he/she cites where it came from.
The Rossetti Archive is a good example of a scholarly project. It has been developed as a basis for the project NINES (Network Infrastructure for Nineteenth-century Electronic Scholarship), which demonstrates that it is built towards scholarly purposes. As it is stated on the website, “the Archive provides students and scholars with access to all of DGR’s pictorial and textual works and to a large contextual corpus of materials(…)” – (The Rossetti Archive, section Home).
3) Integration
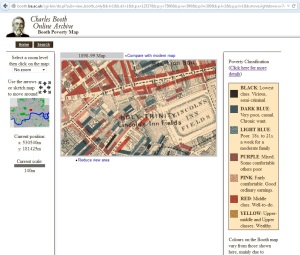 Good DH projects gather a number of objects, maps or even scholarly texts into a single digital interface. This characteristic makes them useful as a scholar or a student can find plenty of information in the same place. Moreover, the digital platforms make possible to conjugate several levels of information onto the same visualization, which would be confusing using printed materials. This is the case of Locating London’s Past, which put together 24 printed maps. Charles Booth Archive is another example. Different colors represent each kind of information, such as crime’s incidence and population through region.
4) Be user-friendly
A good DH project is concerned about how is it easy to a user to figure out by him/herself how the platform works. Being user-friendly involves displaying the information on the screen in an easy way to read and find the data the user is looking for. Locating London’s Past really fulfills this expectation. Besides using design resources to display the information in a clear and readable way, they offer tutorial videos. Besides that, all the tabs follows a coherent organization. 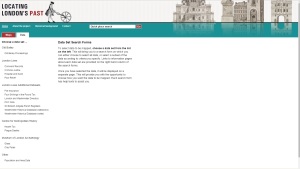 At the top of the page, the user find the two ways of researching – directly onto the map or looking for specific data. Since he decides for data, all the data sets will show up on the left side and the user can pick one up and fill the blanks to find the information he wants.
Thus, part of being user-friendly is presenting the next DH project’s quality – Design.
5) Design
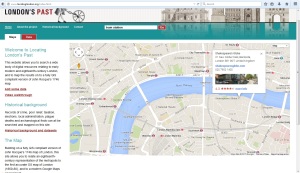 As the article Radiant Textuality explains, “computerization not only vastly increases the amount of accessible information, it enables much greater flexibility in the ways information can be shaped, scaled, and negotiated” (p. 385). Then, a good DH project takes advantage of the design resources to be good-looking, which makes it attractive to the user as well as user-friendly. Using design properly means doing smart choices of colors, different font types and font sizes to organize and categorize different kinds and levels of information. As the image on the right shows, Locating London’s Past is really successful in using design skills. We can identify the use of the variety of font sizes, and a use of colors that is related to the English flag.
On the other hand, the archive Sherlockian.net has a lot to improve concerning to design. The use of colors doesn’t seem to have a purpose. The yellow background and the small font type, as well as the organization of tabs and objects is not very readable and doesn’t attract the user. The links are presented in the regular blue color, which also badly affects the whole appearance of the website.
How DH lets scholars ask new questions?
Through DH, scholarly work can be preserved and self-integrated much better than on paper-based instruments. As Jerome McGann affirms in Radiant Textuality, now it is possible to “integrate the resources of all libraries, museums, and archives and make those resources available to all persons no matter where they reside physically” (p. 381). He adds that “electronic publishing permits scholars to present their work in far greater depth and diversity. Essays can present all their documentary evidence as part of their argument (in notes and appendices, or in electronic links to the original documents). They can also exploit fully the use of illustrations and images, including video film clips, as well as audio clips” (p. 384).
Therefore, DH brings up new issues, that couldn’t be seen without the new technologies such as maps, graphics and visualizations. Scholars and students start to search and identify patterns between data, which was really difficult to do with paper based documents. We didn’t have everything together, online, available to access from any place in the world. Now we can compare information at the same screen, and ask questions about what they signify, which trends we can distinguish. Technologies such as N-grams enable us to exercise these skills of discerning trends and patterns. DH projects can function as a beginning of a research, as we discover some data and start looking for the meaning of it.
Furthermore, digital platforms are available to a broader audience and enable critics to dialogue, as well (p. 387). Thus, scholars can discuss and bring different points of view about some data, which means that DH permits scholars to ask new questions.
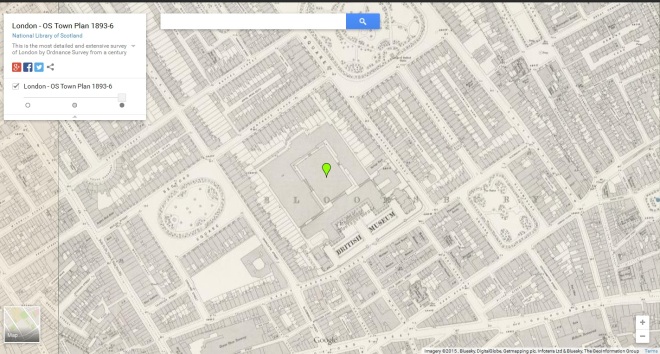 The British Museum is mentioned in the story The Adventure of the Blue Carbuncle when Sherlock Holmes and Dr. Watson are asking the owner of the stolen goose about the place he had bought it. Mr. Baker explains that he is a member of a “goose club”, in which each affiliate would receive a goose at Christmas, after contributing with a small amount of money during the year. Mr. Baker says: “There is a few of us who frequent the Alpha Inn, near the museum – we are to be found in the museum itself during the day, you understand” (in The Adventure of the Blue Carbuncle, p. 5; Arthur Conan Doyle).
I have found this specific quotation very interesting, giving concern to what I have discovered about the place in The Booth Poverty Map. It tells us that the area surrounding the British Museum was not that poor. As the map key assigns, the colors shown around the museum correspond to “Middle class. Well-to-do” populations, some wealthy people from “Upper-middle and Upper classes”. People with “good ordinary earnings”, in a “fairly comfortable” situation also used to live in that area (in Booth Poverty Map, Charles Both Online Archive).
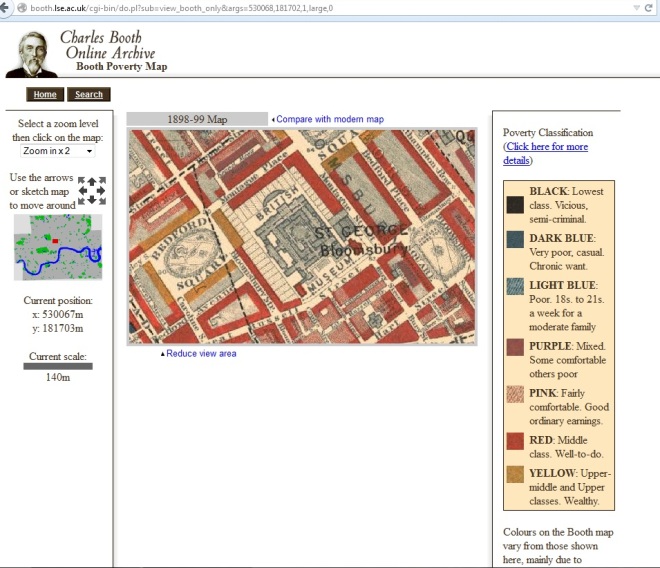 However, if we use the arrows resource to search about the surrounding area, the frame changes. Especially if we go to the north-east, south-east or south-west directions, we find dark and light blue patterns, as the image bellow shows. As the key explains, these colors correspond to “very poor, casual, chronic want situations” (dark blue) and “poor who earned “18s to 21s a week for a moderate family” (Booth Poverty Map, Charles Both Online Archive). However, we can still see significant presence of middle-class families in that area, which suggests that people with really different life styles lived together in the same place. Today it is very unlikely to happen, due to the financial speculation.
Combining these two data, I could suggest a reason for the appearance of the British Museum in the story and for Mr. Baker’s sentence as well. As Holmes has deduced from the hat, Mr. Baker is an intellectual middle-class men even though he is probably running into financial difficulties at the moment. As he is an intellectual middle-class men, it is coherent that he frequents the Museum and the surroundings. However, he remarked that “we are to be found in the museum itself during the day, you understand” (in The Adventure of the Blue Carbuncle, p. 5; Arthur Conan Doyle). I had come up with a possible reason for this statement. Even though the area is populated by middle and upper class families, it doesn’t mean that it is safe. Maybe, during the night, the area was occupied by criminals.
Indeed, some crimes used to happen in the area at night. I have found the case of a theft on George Street, located in the same parish where is the British Museum – Bloomsbury. Coincidentally, this is a case of a hat stealing, that happened in 1819. Both victim and defendant were males. You can see the description of the theft on the image bellow. It tells the details of the action, which is particularly interesting. (from Old Bailey Proceedings data set, at Locating London’s Past)
In addition a curiosity about the British Museum: some renowned names used to frequent the Museum’s Library and the reading room: “Sir James Mackintosh, Sir Walter Scott, Charles Lamb, Washington Irving, William Godwin, Dean Milman, Leigh Hunt, Hallam, Macaulay, Grote, Tom Campbell, Sir E. Bulwer Lytton, Edward Jesse, Charles Dickens, Douglas Jerrold, Thackeray, Shirley Brooks, Mark Lemon, and Count Stuart d’Albany” (in Old and New London: Volume 4, The British Museum part 1 of 2, Chapter XXXIX).
For this assignment, I decided to focus on Fenchurch Street, a location that was mentioned in the Sherlock Holmes story A Case Of Identity. In the story, Fenchurch Street is the location of Miss Sutherland’s step-father’s place of business. Located just around the block from here is Miss Sutherland’s fiancee’s home on Leadenhall Street, which (SPOILER ALERT) turns out to be Miss Sutherland’s step-father. You can see a picture of Fenchurch Street on a map I got from Victorian Google Maps below:
When I looked at the Charles Booth Online Archive, I found out that during the 19th century Fenchurch Street was a very poor area, as you can see on the map and color guide below. The black and blues show that people of the lowest classes lived in this area. This relates back to the Holmes story because Mr. Windibank, Miss Sutherland’s step-father, tried to pose as another man to make Miss Sutherland fall in love with him so he could eventually marry her and take all her money. Mr. Windibank’s place of business was also located just around the block from Fenchurch Street on Leadenhall Street. This area was a good location for Arthur Conan Doyle to put both of Mr. Windibank’s identities in because it shows that he has very little money. If he lived and worked in a different area it wouldn’t make as much sense to the story.
On the Old Bailey Archive, I did a search on my location and found a list of the crimes committed throughout the 19th century. Most of these crimes listed were for all things theft related, like grand larceny, shoplifting, pickpocketing, and even a couple of theft related murders. When I looked at the Locating London website, I found similar results. Then I decided to look at the British History Online website. When I searched my location on there, I found many texts involving businesses and factories, where I learned that this area held many businesses and industries and probably had many jobs that people of the working class had. I’m not saying that poor people were more likely to be criminals, but in order to survive and support their families people of the lower classes needed to do what they could, and theft was probably a last resort option for them to get necessities.
I have chosen abstract topics, which are not too related to History. Nonetheless, I have observed a thematic connection between them, so I divides them into 4 groups.
The related topics of each group show more appearance at the same time periods, suggesting that Arthur Conan Doyle was writing about related themes in each time. Especial concentrations can be seen between 1891-1893, and 1904-1905. After 1908, the release of stories had been constant till the 1920s.
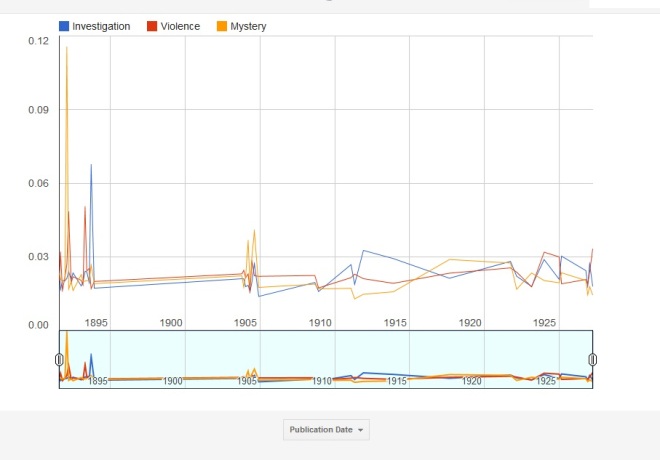
In February 1892, we can see the greatest peak of the whole graph related to the topic “mystery”. This was the release date of The Speckled Band, a story full of words related to mystery, as our class well knows. The peak of “violence” (April 21, 1893), is the release date of The Gloria Scott, a story that ends with a death, which related words are within the “violence” topic. The peak of investigation (September 16, 1893) is related to the story The Greek Interpreter, which involves kidnapping and intimidation, which are material for “investigation”. “Mystery” seems to be the most important topic in the 1904 eight stories, as it stands out from the other topics.
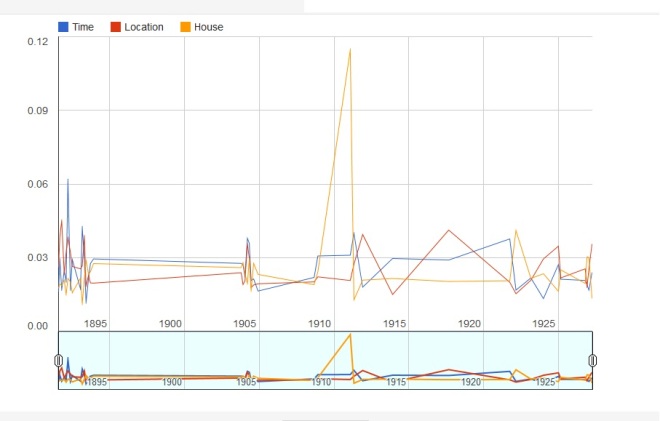
The greatest data here are the peaks of “Time”, in March 16, 1892 – release of The Adventure of the Engineer’s Thumb – and “House” in February 1, 1911 – release of “The Disappearance of Lady Frances Carfax”. The first, happens over the summer (time aspect), and the second involves a pursuit along housing environments.

The principal trends in this graph are a great peak of Relationship in September 1, 1891 (A case of Identity, a story about marriage and the relationship between stepdaugther-stepfather) and a growing appearance of “Conversation” matters in the stories between 1893 and 1903.

I have chosen to leave the most different topic one alone in the forth graph. It is “Sitting”, which includes words such as “chair sat room fire bell laid asked lit lamp”.
The first peak is related to the story The Boscombe Valley mystery (October 16, 1891), which involves traveling by train, carriage, driving, actions that might involve terms around “Sitting”. The second peak coincides with The Adventure of Wisteria Lodge (September, 1908), a story that happens inside a house (so it has related terms to “Sitting”).
All the charts in:
https://www.google.com/fusiontables/DataSource?docid=1ufgEjCptMHdlZwv27O3SJHmlyex_8CcmCwR3NSIe
After applying different settings at the Topic Modeling Tool, I have chosen the result of 2000 iterations, 40 topics and 20 words printed per topic.
TOPICS:
1) Investigation
“case point fact facts points remarked investigation evidence mystery interest follow simple theory incident clue confess obvious problem curious afraid”
2) Time
“day morning days evening made news surprised telegram called meet order explain yesterday week hours spent return caused received longer”
3) Violence
“man found dead body death blood struck terrible dreadful creature poor blow knife wild ground unfortunate stick horrible lay picked”
4) Location
“house road side passed hall front place dog drive windows round drove standing direction high houses yards scene building square”
5) Sitting
“chair sat room fire half laid rose pipe bell arm glass lay asked silent seated alarm lit lamp cigar smoke”
6) House
“room window door entered open bed table left key bedroom study inside round safe sitting rushed floor locked lawn dressing
7) Appearance
“black man red face dark hair thin features tall head appearance figure white middle dress blue eyes glasses yellow faced”
8) Relationship
“husband knew thought heart wife girl told love truth child mind back gentlemen break loved leave mine met mary ferguson”
9) Mystery
“door light stood window opened heard open dark sound passage closed steps silence ran instant front pushed suddenly sharp drew”
10) Conversation
“asked give answered thought matter thing make time business good call start taking kind rest turn happy questions wished excuse”
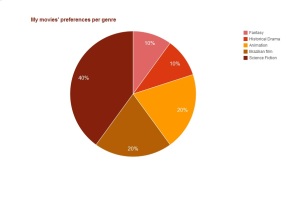
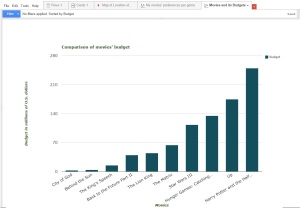
I have selected some of my favorite movies from different genres and nationalities. I was curious to figure out how much each one had cost to be produced. In the case of movie series, I have chosen the one that I like most: Harry Potter and the Half-Blood Prince; Star Wars Episode III: Revenge of the Sith; Back to the Future Part II; Hunger Games: Catching Fire. I also have chosen two Brazilian movies that I admire very much. As I expected, the Brazilian productions had spent very lower budgets than the Hollywood creations, and it is nice to verify this data through visualizations.


Link for google Fusion Tables:
https://www.google.com/fusiontables/DataSource?docid=156_b0bEG8Url9J8yqe3xm5m7bFQlQDOQgBEDECcv
Link for the Spreadsheet:
https://docs.google.com/spreadsheets/d/1PX_0hpj46zaOQBs3ZmVjtjPjk1kJD-1I0h_OpVHIAzc/edit#gid=0
WORDCLOUDS– click on “enable editing.”
Word choice is imperative to determine the historical changes in dialect between the 1892 version and the 1984 television screenplay of Sherlock Holmes: The Blue Carbuncle. I’ve developed a deeper understanding of the societal shifts in history using word clouds and the word tools used to construct them.
Similar to Wordle, Voyant and Tagxedo, iLanguageCloud generates a word cloud that enlarges the most frequently used words found in a submitted text. My computer does not allow me to use java programs and, for whatever reason, would not let me update it so my choice in word mapping tools was limited. What I realized is that Java is essential on mobile platforms to navigate through Wordle and Tagxedo leaving Voyant as the only word cloud software tool compatible for both mobile usage and computers without Java installed. This simple inaccessibility is a concern for both Wordle and Tagxedo. These sites need to take in account the amount of mobile users who use their phones primarily for electronic applications and software. Wordle and Tagxedo must develop mobile friendly software to accompany their desktop companions in order to keep up with the digital age. Though I was inable to constitute a Wordle or Tagxedo word map, utilizing my mobile phone, I downloaded the application iLanguageCloud—a high comparable software tool alternative for word cloud creation.
The words: remarked, pray, retained, yes, market and case are used in Arthur Carter Doyle’s original 1892 version of The Blue Carbuncle; the words: foresight, milady, yeah, museum, jewel, God, police, and money are used in John Hawkesworth’s 1984 version. Both sets of words are respectfully divided using the iLanguageCloud software application for the smartphone.
In the first word cloud, generated by iLanguageCloud, we note the shift from “yes” to “yeah” as a formal to informal verbal transition from 1892 to 1984. We can see that “pray” is used in Doyle’s version while “God” is used in Hawkesworth’s version signifying a religious connection between the two. The words “remarked” and “retained” are used only in the 1892 version since they are observational words used by Watson and, being that the 1984 version is told in 3rd person, are of ill usage towards progressing the story. Before moving on to deeper connections, I will introduce the Voyant word cloud I developed using the same two versions of Sherlock Holmes: The Blue Carbuncle.
From an aesthetic standpoint, the iLanguageCloud word map produces an immaculate display of words in a neatly organized in a visually appealing array of spacing. The colors are vivid and the words, though numerous, do not feel squished, scrunched or displeasing to the eyes. This word map features a black background which makes the colorful words pop out, allowing easy readability and engagement. The Voyant word cloud offers an agitating bundle of colors pressed uncomfortably together in front of a white background. Voyant does not have nearly as many words displayed as iLanguageCloud does and yet, the spacing, alignment and design of Voyant’s word cloud is visually atrocious. Voyant offers 5 different colors varied between the multi-sized words framed in its oblate spheroid structure. iLanguageCloud offers around 15 colors that are much more thoughtfully designed, spaced and configured for optical viewing. Though Voyant may be less asthetically pleasing and does offer less words, Voyant displays keywords that iLanguageCloud did not pick up—perhaps more important for some aspects of comparison.
Voyant picked up the words: gas, beer, pounds, money, books, sold and police in John Hawkesworth’s 1984 version. This set of words is not found in Arthur Carter Doyle’s original 1892 version of The Blue Carbuncle. This is because within a century, the world became much more materialistic as commodities naturally became a larger part of our vocabulary, dialect and conversations. It’s interesting to see the word “gas” used in the 1984 version because the first gasoline powered automobile was developed in 1893—one year after Doyle’s version was published. In 1984, “gas” had become a commonly used word after automobiles became a commonplace method of transportation. Using word clouds allows us to infer connections of societal changes between two historical time frames.
Aside from the addition of materialistic references in the 1984 story, both 1984 word clouds suggest an upgraded view of women from the overtly misogynistic view of women in the 1892 version. Although perhaps a small detail, all four word clouds utilize the words (abbreviations) “Mr.” and “Mrs.” However, the word “Mrs.” is significantly larger, and thus more frequently used, in Hawkesworth’s word cloud than Doyle’s. We can infer that as time went by, women became more thoughtfully incorporated characters in Holmes’ stories in opposition to the sexist vision of female characters in 1892, portrayed as inferior for Sherlock’s amusement. iLanguageCloud also highlights the term, “milady,” used to address a woman in a noble manner. This term is found only in the 1984 version because Doyle would not have his male characters address women in this fashion.
Comparing iLanguageCloud and Voyant word clouds, we can identify the historical shift in language usage and its impact on our perception of both versions of Sherlock Holmes. Word cloud users are able to evaluate the context of each version’s social matter to recognize shifts in materialistic terminology as well as the transition to lesser misogynistic viewpoints. While iLanguageCloud offers a more in depth, visually appealing display of word mapping, Voyant offers a similar exhibition of vocabulary that highlights many of the same historical observations used to compare and contrast the century divided time periods of Sherlock Holmes: The Blue Carbuncle.
The words that I had wanted to compare was Poetic and poetic. I chose these words because I wanted to see how often this word was being use to describe various people ,if there was a relationship, and when the word began to gain traction.
Starting with my results on the graph, you don’t see much of a difference until about the mid-1830s where poetic, with a lowercase, is being used more often, about four times more often at which point, around 1883 it begins to skyrocket and it is used 5x more than Poetic, with an uppercase. In 1838, Charles Dickens works such as “Oliver Twist” was written and it explains the reason for the increase in the use of that word during that time period. The skyrocket in the 1880s can be attributed to other famous works such as “King Solomon’s Mines”, “Dr. Jekyll and Mr. Hyde”, and of course “Sherlock Holmes”.
Based on this research, you are able to infer that if a piece of work comes out during a certain year, that turns out to be a worldwide phenomenon, it will be searched more due to it being a cultural phenomenon, regardless of how brief a time. This represents a positive correlation and evident cause and effect between popularity and search terms. I believe that if a piece of poetry comes out in a few years that has the same impact on our generation this effect will be the same.
I believe that there is such a difference because poetic (lowercase) was used more as an adjective to describe the people who were living around that era. Looking at the data you are also able to tell that the word became more culturally acceptable and began to be used a lot more throughout this time period.