Qualities of an effective DH project

A Digital Humanities project must be, above all else, holistic. It must encompass all elements of a topic that are available to be documented. The ease of access to said information that the internet provides is unprecedented in human history, and that means there is no excuse to use every bit of proof possible to prove any hypothesis, or any imagery to create any scene. That said, there are a few essential elements which must go into a DH project so as to reach this lofty goal.

A bevy of archival data: Simply, at the most basic level, there must be information present to establish the idea being proposed. Some type of base record must be present; for example, if one were to document crime in London during the 19th century, the first stop would be the Old Bailey archives, where thousands of such examples may be found. These bits allow the project maker to contextualize and form the skeleton of the project.

Geographic information: Maps are good. If it’s a cultural project trying to demonstrate influences on Shakespeare’s writing, then showing migration, population density, and plague victim maps during his lifespan can be vital to showing points of influence. Of course, this is absolutely non-negotiable for map-based projects, but GIS data can greatly enhance even the most elaborately assembled of projects.

Organized displays: A good DH project must have information presented in a human fashion: infographics and well designed presentations are solid choices, but hastily assembled slideshows and narrated videos are far too limited to actually depict anything. Augmented reality and GIS map overlays are cutting edge and, if someone has the capacity to utilize them, they should consider it.

Supporting sources: If any non-primary source articles exist about your topic, it doesn’t hurt to lump them in. While primary source is key, having someone accredited backing up your project (having come to the same conclusion, or, at the least, a supporting one), never hurts.

Relevancy: All data and referenced sources must be relevant to the topic. Shoving information in people’s faces is not informing them, it’s overwhelming them.

What Makes a Good DH Project?

Qualities of a Good DH Project: Large Data Set, Citations, Aesthetically Pleasing, Interactive, Search Feature

The new wave of scholarly work that is known as the ‘Digital Humanities’ is all about data (and lots of it). When the humanities and technology converge to create new research and discoveries, large amounts of information are compiled in order to do so. New questions cannot be asked without analyzing as much information as possible, so as to ensure a secure basis for those new inquiries. Living in the digital space, a Digital Humanities project is worth exploring if it has some key qualities.

A great DH project has a large data set that it pulls from, references, analyzes, reflects, or even contradicts. The more data there is in a project, the more expansive and the greater the opportunity to analyze findings, identify trends, and pose new questions. With that in mind, with large data comes large responsibility …to be scholarly. Incorporating lots of data is a wonderful first step, but citations are the important second step. The credibility of a project determines whether it is considered scholarly, and the best DH projects not only reveal new data, but also openly share the original data that the project pulls from.

The advent of digitizing works of the humanities creates a new question of ‘what will the digitized project look like?’ No matter what the project, a good DH work should be aesthetically pleasing. This does not mean that it needs to be reminiscent of the Romantic era, but it does need to look clear, rather than cluttered or illegible. At a glance an aesthetically pleasing project will look like it relates to the data that it is based upon. For example, a good mapping project or Ngram will be legible and clear, and a good topic modeling or word cloud project will at a glance be somewhat representative of the publications it is pulling from.

Aesthetics of a project are important for the analysis and exploration of them but looks aren’t everything. A good DH project is interactive. Depending on the type of project, this can be interpreted in several ways. In a word cloud visualization, the ability to hover over or click on words to learn about their frequency and other information is one form of interactivity. On a map, this could just mean the ability to zoom in and out, or it could mean having the ability to plot data points on a map or compare a map form the past to a map from the present. No matter what the form of engagement, a good DH project will take advantage of the endless possibilities that the digital space allows.

Related to project interactivity, a great DH project has some kind of search feature. The ability to not only explore the information in front of you in a project, but to also quickly explore related texts, visuals, maps, and more is what makes the digital space unique. Digitized projects that live online allow web surfers to have a world of information at their fingertips. On a map, searching could just mean plotting data on a map or it could mean searching for a specific street in a city. In a topic modeling project it could mean looking up metadata regarding a specific word across a corpus of texts. No matter what the search function, its addition to a project allows for that immediate exploration, analysis, and creation of questions.

The field of Digital Humanities has a modern goal made possible by the World Wide Web – to engage a broader network of scholars in the pursuit of knowledge of the humanities. Pulling discoveries from the modernization of dated texts, works, and arts, this field allows scholars to ask new questions because of the ability to share content online across oceans and continents. The “Digital” in Digital Humanities provides both an increase in accessibility and a modern approach to works of the humanities. Greater access means greater possibility of discovery and taking a modern look at older works creates for a new lens through which scholars can evaluate the past. Increased accessibility of old and new works, a broad network of scholars, and the use of digital tools all allow scholars to ask new questions through collaboration, detailed analysis, and modern technology.

Mapping Fleet Street in the Victorian Age

I chose to search the popular London location Fleet Street which is mentioned in the Sherlock Holmes story “The Red-Headed League.” This tale is one of the less dramatic mysteries that Holmes explores, and when I first read it, the mention of Fleet Street caught my eye. I primarily knew the street as home to Stephen Sondheim’s Demon Barber and Mrs. Lovett’s meat pies. In the story of The Red-Headed League, a man gets tricked into working at an office on Fleet Street, assisting with the manual copying of the Encyclopedia Britannica. His new “league” mysteriously disbands very suddenly and with a turn of events, we learn that the office on Fleet Street was a decoy for another crime to take place. As the map from Victorian Google Maps below shows, Fleet Street is broad and stretches across several intersections in central London.

Fleet Street on the Victorian Google Maps
Fleet Street in the Victorian Age, Courtesy of Victorian Google Maps

Fleet Street was known as “a tavern street, as well as a literary centre,” according to historicaleye.com, a website composed of a compilation of academic works about various historical events/locations. Through exploring this and several other sites, I learned that Fleet Street is known as more than Sweeney Todd’s home. In fact, by 1896 several notable writers are cited as having inhabited the street’s pubs; “Shakespeare, Ben Johnson, Raleigh, Dryden, Johnson, Goldsmith…are closely associated with this famous street” (historialeye.com). In regards to this website as a scholarly archive tool, the section on Fleet Street and The Strand on historicaleye.com is difficult to find if accidentally navigated away from. There seem to be two very different parts  of this website – the Then and Now section about London that features historical summaries of London locations in 1896, and the newly “renovated” part of the site that is exposed when clicking on the home button. With no search bar on either of these parts of historicaleye.com, exploration was left only to clicking around the tabs most relevant to London.

The interesting combination of literary greats and taverns is reflected in the socioeconomic status of Fleet Street. Using the Charles Booth Online Archive (http://goo.gl/Jg­RmhL), I looked for the street to learn about its economic makeup in the 1890s. Based on the Charles Booth Poverty Classification Legend, the map below shows that the end of Fleet Street where it converges with the Strand had many middle-class/well-to-do individuals living here, as noted by the red markings. Both Victorian Google Maps and the Charles Booth map note that there are many banks on the part of Fleet Street that approaches The Strand, so the increase in well-to-do individuals correlates well.  Though the map is not very clear to read, I interpret the light blue/gray along the center of Fleet Street to represent the “poor 18-21 year olds” from the Booth Poverty Classification Legend. To the right of Fleet Street as it approaches St. Bride Street, all of light pink represents the population of people who were “fairly comfortable” with “good ordinary earnings.” From well-to-do individuals to poor young adults, this street had a variety of people passing through it in the late 1800’s, further  verifying the reputation of taverns and great Victorian writers in one place.

Using Charles Booth's Poverty Classification Legend, this map shows that the end of Fleet Street that converges to The Strand had many middle-class/well-to-do individuals living here as noted by the red markings.
Fleet Street on a 1898-1899 Map of London


The broad range of socioeconomic status on Fleet Street prompted interest for me to explore the types of crime that were documented at the time of the Charles Booth Poverty map. Below are cases that either took place on or involved Fleet Street and therefore surfaced as search results on Old Bailey Online (www.oldbaileyonline.org/static/London-life19th.jsp), an archive that houses centuries of London court cases. Limiting my search to 1896-1898 to coincide with the Poverty Classification map, I found an interesting trend in crimes in the late 1890s on Fleet Street. If I were topic modeling the cases below, it’d be easy to detect the highest trending topic for court cases…theft. Two counts of burglary, two counts of pocketpicking, and two counts of fraud all point to the majority of crimes revolving around stealing money on this street. The somewhat broad range of socioeconomic status may have been responsible for these crimes. These court case crimes, including the extreme manslaughter charge and then perjury and larceny charges all sound like the London that Arthur Conan Doyle depicts by means of Sherlock’s cases, while also relating to the variation of inhabitants’ economic statuses at the time.

A list of cases from the Old Bailey Online Archive that were documented as taking place on Fleet Street in the Victorian Age


Sources:

“Booth Poverty Map & Modern Map (Charles Booth Online Archive).” London School of Economics & Political Science, Web. 09 Nov. 2014.


Rees, Simon. “Fleet Street and the Strand.” Historicaleye.com. Simon Rees. Web. 09 Nov. 2014.


Tim Hitchcock, Robert Shoemaker, Clive Emsley, Sharon Howard and Jamie McLaughlin, et al., The Old Bailey Proceedings Online, 1674-1913 (www.oldbaileyonline.org, version 7.0, 24 March 2012). 09 Nov. 2014.


Visualizing Popular Sitcoms of the ’90s

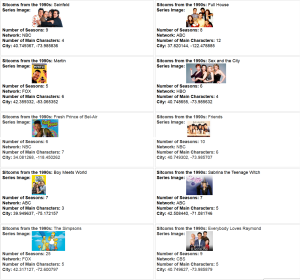
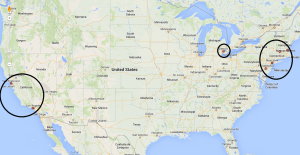
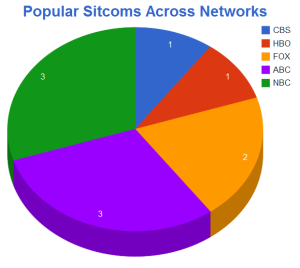
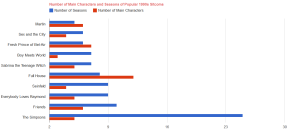
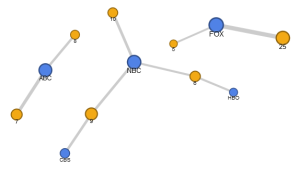
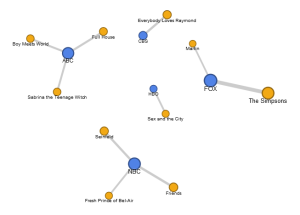
Using Google Fusion Tables, I explored commonalities between 1990s sitcoms because they all followed a similar storytelling formula. Looking at 10 shows, I mapped out the locations of the settings for each show, finding that nearly all of them took place on the east or west coasts. The pie chart reveals the number of shows per network and the bar graph shows its data points comparatively. What’s most interesting to me is the network view. The connections between broadcast/cable network and series is a more visually engaging way of sharing the information. http://wp.me/p4UATe-fk


Squares
Data Cards
Show City and US
Where in the world were these shows taking place?
Number of Sitcoms Across Networks
Number of Shows per Network
Seasons and Main Characters
A Look at Number of Seasons in a Series and Number of Main Characters
Network and Num of Seasons
Connections Between Network and # of Seasons
Network and Sitcom
Network View (Literally) of Series’


“A Scandal in Bohemia” Word Cloud

Many people hold word clouds, wordle in particular, in a negative light. While I agree that, yes, sometimes word clouds can complicate things more than they clear things up and make posts look messy, if done correctly they can be quite useful.

a scandal in bohemia

Above is a word cloud of the short story A Scandal in Bohemia,  by Arthur Conan Doyle. I used wordle to create this visual because I knew how to work it and I found it was best suited for what I wanted to do. If someone were to look at this word cloud, they would already know that the story was about Sherlock Holmes, a king, and a photograph because those are the biggest words in the cloud. The black and white color scheme makes it easier to read because the black words stand out against the white background. I enjoyed picking which font to use, though it was frustrating because a lot of them were very hard to read. I picked this font because I felt it had more of a Victorian feel than any of the others. So, right off the bat, someone would already know that this Sherlock story was about a king and a photograph, and also, if he was using his context clues, that it was written a long time ago.

I think word clouds are best left to help someone get a basic understanding of a book or of an idea, not to be used in a serious argument unless it is absolutely necessary. All and all, there is a time and a place for word clouds, and if you’re a beginner with web tools, wordle can be very useful.

Digital Humanities is Huge at UCLA!

Digital Humanities at the undergraduate level is huge at other universities. Check out UCLA’s description about DH:

Digital Humanities interprets the cultural and social impact of new media and information technologies—the fundamental components of the new information age—as well as creates and applies these technologies to answer cultural, social, historical, and philological questions, both those traditionally conceived and those only enabled by new technologies.

There are lots of cool courses that show how DH is growing at colleges: http://www.digitalhumanities.ucla.edu/