Topic Modeling

The ten topics I have are murder, travel, house, description, religion, divorce, schedule, job, investigation, and performance. While graphing the topics on google fusion tables I put topics like murder and investigation together in one chart to show the correlations between the two and how one rises while the other falls or stays the same. I tried to put together for the most part topics that were similar and would show an interesting relation to one another. I also looked up historical events or the times that certain Holmes stories were published to further analyze what was happening in the graph.

Murder v.s. Investigation

Screenshot (3)  While looking at the spike of investigation at around 1891 I started to search for murders around 1891. Although I came up short I did realize that Jack the Ripper, a killer who stabbed at least five prostitutes and mutilated four in London, was never really identified although they had several suspects they couldn’t pin point it to one man. While reading about this it came to me that investigation could be at a peak because from 1888 till about 1892 they were investigating and trying to identify this killer. Another chilling discovery was Johann Otto Hoch who was a German con man who claimed up to 50 victims possibly more. I also think he could be the reason investigation spiked because from 1888 till about 1891 he couldn’t be found then he was and in 1906 he was hanged. I believe the reason while investigation and murder correlate so well is that when murder occurs investigation peaks because they are trying to find the murderer, but when murder peaks investigation slowly rises because it is just beginning. This link shows Jack the Ripper as well as Johann Otto Hoch and what I was describing http://en.wikipedia.org/wiki/List_of_serial_killers_before_1900.

Divorce v.s. Religion

Screenshot (7)

I searched very rigorously to find any correlation with religion and divorce online, but what I did find was that divorce rates in England increased and decreased, but not drastically, and stayed in the same range for the most part.http://www.theguardian.com/news/datablog/2010/jan/28/divorce-rates-marriage-ons is the link I used to find the divorce rates. What I could theorize is, some people that were married by the time they reached their thirties which was about the age you divorced found that they had different religious ideals than their husband. Another theory is that around this time period money could of been an issue with the end of world war one, and peoples husbands either dying or have become disable now are falling on tough times and need money or will simply divorce their husband.

Performance v.s. Schedule

Screenshot (8)

I didn’t know how two relate the two other than when you watch a performance you put it in your schedule but when I dove deeper into what could be the relation between the two I saw so much more. What noticed was that when I went to England recently I noticed that the theater district in the west end was so elaborate with many different shows and as I dove deeper I realized England has been doing theater since the 1700’s. In this link it shows all theater shows form the 1700’s to 2010 in England: http://www.guidetomusicaltheatre.com/london_shows_chronology/1700s-on.html. I also realized that at the peak of the scheduling line (in the graph) it was in 1893. The Holmes story the resident patient came out and it deals with a lot of scheduling jargon which could also be why scheduling peaked around that time. http://www.angelfire.com/ks/landzastanza/publication.html.

House v.s. Description

Screenshot (9)

While reading through some of the Sherlock Holmes stories I noticed that a lot of descriptions relate to house hold items or are in a house which correlated to the rises on the house line in the graph. I also put together that the reason these are so close together on the graph is because they go hand in hand.

Travel v.s. Job

Screenshot (10)

While looking at this graph I noticed that travel peaks a lot. The reason I think it goes up is because a lot of people in England have to travel to get anywhere whether it be taking the tube, or a carriage. While I was in London I noticed everything revolved around transportation which could be the reason for the peak. Also transportation and jobs go hand in hand because in order to get to your job you need to take some mode of transportation.


Topic Modeling Part Deux

The ten topics I originally chose were crime, love, money, face words, “chillin’ like Sherlock” (my strangely-named topic for words like pipe, sat, fire, smoke, silence, and bachelor), male descriptive words, detective words, investigation, sailing, and death. The following graphs show how some of these topics relate and, in exceptional cases, reveal interesting correlations with historical events that took place at the time when the stories in which they appear were printed, which I found really intriguing to delve into and analyze.

Detective/Investigation

Chart 1

These topics seemed similar enough. Ironically, however, trends appeared somewhat sporadic throughout, though there was a strong correlation roughly from 1909 to late 1911, with a significant peak in early 1911. This correlates most strongly with the release of The Red Circle (http://sherlockian.net/), though I couldn’t find any historical relevance.

Crime/Death

Chart 4

These topics, clearly connected through the crime of murder, showed a close trend in March 1922, the time of release of Thor Bridge (http://www.sherlockian.net/). In this story, the crime is, of course, murder (http://en.wikipedia.org/wiki/The_Problem_of_Thor_Bridge#Plot_summary). No related historical events were found.

Sherlock/Male

Chart 2

Yet again, these topics seemed to make sense together, but trends were very sporadic. There was, however, a directly correlated peak in March 1923, the time of release for The Creeping Man (http://www.sherlockian.net/), which makes perfect sense for obvious reasons. No direct historical relation was found.

Money/Sailing

Chart 3

Figuring sailing and money were both tied to trade, I decided to look for trends between these two topics. Interestingly enough, “sailing” peaked in March 1904, then dipped in April 1904, at which time “money” spiked. In April 1904, the Entente cordiale was signed (http://www.branchcollective.org/), which established peace between France and England, likely opening up trade between the two, which makes sense with the spike in money-related words. The cause of decline in sailing-related words at this time, however, still remains unclear (or possibly unrelated).

Love/Face

Chart 5

Figuring these words might be related through the written portrayal of how people respond to the people they love (with regard to facial expressions, at least), I thought it might be worth comparing the trends between the two. Sure enough, they peaked together in March 1922 and January 1924. March 1922 was the time of release for Thor Bridge (http://sherlockian.net/), which seems to be sort of a fluke in terms of trying to explain the relation to the prominence of these topics. January 1924, however, was when The Sussex Vampire was released (http://sherlockian.net/). This story, featuring a child as the culprit (http://sherlockian.net/), in conjunction with the obvious implications in its name, seems to fit the bill for a story that would predictably feature frequent mention of the topics of love and things having to do with the face. I was not, however, able to find any direct historical relation to the prominence of either topic.

Topic Modeling Part 2

The ten topics I initially chose were: crime, case solving, observation, economy, body, morning/night, appearance, passing of time, written documents, and setting.

sh topic model chart 1

First, I decided to compare the topics of crime and case solving. There seemed to be a dramatic increase in the appearance of crime from 1894 to 1904. Upon looking back at the topic index, I found that the largest prevalence of crime was in The Adventure of the Second Stain, which was published in late 1904. Indeed, a decade after the original Adventures appeared in The Strand, a series of others were published known as The Return of Sherlock Holmes. The appearance of both crime and case solving varied throughout 1904, and while dipping over or under each other, they remained close until 1927.

Continue reading

Topic Modeling Analysis

From these topic modeling graphs, trends in the Sherlock Holmes stories as well as the real world can be seen.  It is safe to say that this was the popular culture back in the late 1800s/early 1900s just from seeing the themes within the story.  I thought it was interesting to find the relationships with real world events.

Screen Shot 2015-04-03 at 2.08.40 PM

The first chart shows “crime”, “crime scene”, “murder”, “family and relationships” and “investigation”.  There are a couple of large spikes for family and relationships, especially in the 1920s, although a quick google search leaves me empty handed.  Crime also shows a spike in the early 1920s as well, and this could be because of The Red Scare, which was not exclusive to the United States.  During this several high profile cases in the United States such as, Sacco and Vanzetti as well as the Scopes Monkey Trial have occurred. By this time, news sources in Great Britain would have got word of these cases. The other three topics are very related to crime in itself.

Screen Shot 2015-04-03 at 2.02.08 PM

With the next chart, which shows “finance” and “foreign affairs”, there is one large spike for foreign affairs on September 1st, 1917.  The Great War was still going on, and this was the year the United States entered the war.  Also, Germany has declared unrestrictive submarine warfare several months earlier.  Russia’s position in the war was being questioned as Bolsheviks started to gain more control in Russia, starting with the abdication of Tsar Nicholas II in March of 1917 as well as continuing riots in the country.  Finance unfortunately does not receive the same attention that foreign affairs has been receiving.

Screen Shot 2015-04-03 at 2.57.56 PM

With the last chart, dealing with “smoking”, “residential streets” and “transportation”.  A large spike in residential streets is seen on January 1st, 1904.  In this year, road infrastructure is still in its infancy, roads were still poorly made, cars were not as widespread and modern traffic laws have not been drafted yet.  What is quite strange is that transportation does not see as large of a spike even in 1908 when the Ford Motor Company introduced the Model T, which has quickly become the most popular car around the world, beating British brands such as Austin, Rolls-Royce and Bentley.

Historical Interrelation: Words and War


Sir Arthur Conan Doyle penned all the Sherlock Holmes stories between 1891 and 1927, creating a literary legend that would not soon be forgotten. By using topic modeling techniques and some fancy algorithms, we can investigate the potential relevance of word usage in his stories.

The Great War was a momentous event that almost exactly bisected Doyles’ creations, so I will view my ten topics through this lens. I found an interesting website for historical background on London during this time period, which helped me to identify significant events.

Estate vs Business

Screen Shot 2015-04-01 at 2.39.52 PM

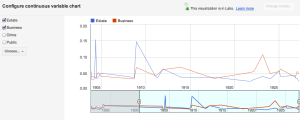
In contrasting estate and business, I noticed a spike in the former before 1905 and again before 1910. This could have been because British colonies had large tea estates in India. However, estate crashed back down after 1910 and business led throughout the rest of the time period. It is possible that the industrial growth of London led to this change, and both words are lower during the war and flu pandemic of 1918.

Search vs Case

Screen Shot 2015-04-01 at 2.40.18 PM

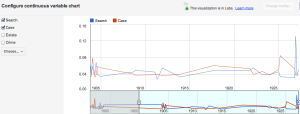
Regarding search and case, there is a slight rise in each during the war years. Once again, the flu of 1918 and the peak of both words during the 1910-1920 decade may involve correlation rather than causation. The term search may also have increased during the war because soldiers could be missing in action.

Crime vs Reasoning 

Screen Shot 2015-04-01 at 2.41.01 PM

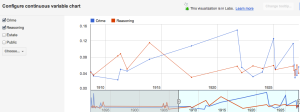
Reasoning was mentioned more than crime prior to 1915, but the use of crime skyrocketed after this, calming back down in the 1920’s. This fits well with the suffrage movement and trade unions growing, as this disrupted established society. From the 20th century London website:

The suffragettes, the Irish ‘Home Rule’ movement and trade unions all agitated for change, sometimes with violence. In 1918 some political demands were met through the Representation of the People Act, which gave the vote to working men and women over 30.

Appearance vs Expression

Screen Shot 2015-04-01 at 2.41.19 PM

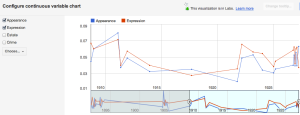
Appearance quite possibly became less important than expression after the war, due to the realities it forced upon the people of London. This trend continued through the 20’s, as the growth of jazz may have led to expression becoming more common.

Silent Reflection vs Public

Screen Shot 2015-04-01 at 2.41.36 PM

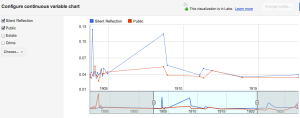
Silent reflection had an interesting spike in 1908, and it dropped precipitously, becoming equal to public by 1914. It is possible that the Alien Act impacted this word usage, as many immigrants tried to come to London during this period. Perhaps many Londoners had thoughts about the impact on their society, but the war decreased their time for such thoughts.

While I am not certain about these linguistic developments, I feel topic modeling could be an important tool to help scholars revisit the past, specifically helpful in distinguishing how history affects word usage.

Lauren Gao’s: Topic Modeling II

After performing last week’s topic modeling on all 56 Sherlock Holmes short stories, 10 out of the 100 topics generated from last week were put into Google’s Fusion Tables to check for trends in the 10 particular topics of our choice. I chose to mainly look at the time period from January 1892 to July 1893 being that it contained a high concentration of published Sherlock Holmes stories.

The first two topics I looked at and compared were,

Murder and Villains

Screenshot (56)

Continue reading

Topic Modeling Results

I first decided to compare the topics of “crime scene”, “writing”, and “crime solving”. In the beginning of the chart, writing spikes significantly in 1893. I wasn’t able to find any major reasons why this happened history wise, but when looking at the date of the publication, I found out that this came from The Adventure of the Reigate Squire. In this story, the main clue that Holmes and Watson find is a torn piece of paper found in the victim’s hand, which (SPOILER ALERT) turned out to be written by the murderers. Crime scene seems to fluctuate until it spikes in 1908. From then to around 1925, it seems to stay pretty constant. I noticed that crime solving seemed to be pretty steady with crime scene, and would increase/decrease at around the same times, which I thought was interesting.   Screen shot 2015-04-02 at 10.41.39 PM

The second set I decided to compare was “light” and “smoking”. I put these two topics together because I thought the words in the light category were words that would be used when lighting a cigar/cigarette. The main thing that I noticed in this chart is whenever one rises/decreases, the other does as well, which makes me think that my first assumption was correct. And when you look from around 1920 on, you can see that although they are at different levels, they increase and decrease in the same pattern.

Screen shot 2015-04-02 at 10.41.53 PM

The third set I compared was “time” and “physical description”. I thought that the two would have some things in common based off of physical descriptions over time. But after doing some research, I unfortunately wasn’t able to find much of anything that would tie these two categories together.

Screen shot 2015-04-02 at 10.42.05 PM

The last categories that I analyzed were “marriage”, “business”, and “travel”. A cool thing I found was when I noticed that business made a huge peak in 1904, and after doing a little research I found out that this was when the telegraph started becoming more popular in common society. I also found that the 1904 World’s Fair occurred during this time, which was a big time for business and introducing new products to the world. Travel peaked in 1908, and I found out that this was when Ford first began making the Model T, which was a widely popular car during this time.

Screen shot 2015-04-02 at 10.42.15 PM

Overall, I thought this assignment was interesting, but when it came to figuring out how these categories compared to things in history I didn’t find it very helpful. I thought the spikes in the charts would lead my research to significant things throughout history but most of the time I couldn’t find anything, which was a little disappointing.

Money detective security

The first graph I did was comparing the topics of Money, Security/Protection and Detective. The clearest spike is for Security/Protection in June of 1904, historically I could not find anything that was happening at this time to explain this. There was a war involving and other small conflicts but nothing that could directly be pinpointed.  I then turned to Sherlockian-Sherlock.com to see what exact story was published at this time and the story is “The Adventure of Three Students.” The topics of money and detective also spike around this time which would lead one to think that the story mentions all three of those topics.  There is a spike with both security and money at the same time which is September 1917, which is due to the publishing of the story “His Last Bow”

money room

This next graph surprised me a little. I wasn’t sure if there would be much of a relationship between the topics of money and room descriptions but surprisingly the two topics seem to move together along the graph in unison. Aside from money peaked around 1925 and room description does not they basically peak at the same times. One again I had trouble finding anything historical that explained this. They both peaked in 1904 and as I said earlier nothing too significant happened in 1904 that would affect these topics. There were some wars and what not but nothing related to rooms or money.  I once again looked at the Sherlock stories themselves using the same website. Money peaks in March 1904 but there were no Sherlock stories published during this month and room descriptions peaked during June which again is “The Adventure of the Three Students.”


relationship apperance face

This graph did not surprise as much because I assumed the topics of face/head and appearance would move together and I also figured that relationship was closely related to those two. The peaked of both relationships and face/head can be contributed to the story “The Adventure of the Stockbroker’s Clerk” The story is about brothers and talks about family resemblance with could attribute the face/head part and because it is about brothers discussing the family relations can account for the relationships topic.

time travel

This graph it was a little easier to find history to understand the peaks. There is a slight peak for time in September of 1908 and I believe this is because of information I found on semicolonblog.com that states that a German mathematician was the first person to ever define time as the fourth dimension in September of 1908. There is also a very noticeable peak in travel around 1908 and I believe there could be two reasons for this. According to inventors.com in 1908 Henry Ford improves the assembly lines for cars, and the Hydrofoil boat was invented. I was surprised that travel did peak in 1903 when the plane was invented but instead it actually had a low in that year.

Writing and Travel For this graph the travel peaks are obliviously the same as the last graph. I thought comparing the two would work because I thought that as travel improved writing especially letters may also improve since there was better transportation for sending of those letters and the two topics are not too far off in the graph.  I could not find a reason for writing peak when it did so it may once again relate to the Sherlock stories alone. I’m not too sure.

Overall, I found topic modeling and graphing to be a bit difficult and I feel that personally I was not able to see anything new about the stories or the topics because of the graphs. I think maybe in different situations topic modeling would be more useful but I had a tough time with it.


Topic Modeling Graphs : An Investigation

Welcome to my topic modeling project! Throughout my research as to find some trends for these three different graphs, I have come across some rather interesting finds. Much like a topic modeling project we had reviewed in class, I was really interested in the historical aspects that may have inspired Sir Arthur Conan Doyle to include certain topics within his many stories. Here we go!

Writing

Screen Shot 2015-04-02 at 8.48.46 PM
“Writing” topic model. Note: the blue line represents stationary/paper products

The first topic that I created was Writing, with three subcategories : Stationary/paper products, secret letters and sending mail.

If we look at the left-hand side of my graph, we can see that all three topics had a huge spike around 1903 – so that year was the one that I searched around for.

According to The New York Times’ archive named “On This Day,” in Sept. of 1903, a cartoon of a “major post office scandal” was published in Harper’s Weekly, exposing some violations that a prior story had touched upon in March of the same year of a corrupt post master in the United States. I’m not certain if this would have any effect on Doyle’s work being that he was in a different country, but news travels fast – especially about scandals.

Speaking of scandals, I found a rather interesting English scandal that relates to the topic with the highest peak – secret letters.

I stumbled upon an original Daily Mail UK article that provided “never before seen” photos of Edward VII’s mistress – a woman named Lillie Langtry. According to a caption underneath one of her photos, “Langtry was a regular in high society- and counted Oscar Wilde and Arthur Conan Doyle as close friends.” Ah, such a small detail to this particular article, but a huge win in terms of my topic model research! If he in fact was friends with this woman, I’m sure that her scandalous personal relationship with a married man was an inspiration for his writing, hence why “Secret Letters” would be the largest peak on this graph.
Here are the topics that were covered under my “Secret Letter” classification, for reference:

word men american message words english short picture affair change give single letters copy criminal figures meaning agony dancing hilton

Langtry was English, as well as Edward; they had an affair; and she eventually immigrated to America following their secret romance. Coincidence? (I hope not, because that is a pretty interesting find if I do say so myself!)

According to the article, “Langtry is rumoured to have been the inspiration for the character of Irene Adler in Arthur Conan Doyle’s Sherlock Holmes tale, A Scandal In Bohemia.”

Crime

Screen Shot 2015-04-02 at 8.49.38 PM
Crime topic model graph

Now, onto a rather complicated looking graph on crime! This graph is divided up into four different topics: homicide investigation, house fire/arson, stabbing and detective. There are about four different peaks on this graph between the end of 1903 and October of 1904 – and I was out to see if there were any reasons behind this, aside from the possibility of them peaking due to publication date. Here are my findings:

I wasn’t really even sure where to start with this, so I began with a general Google search of “1903 crime UK.” I then stumbled upon a WikiPedia page on gun control laws in the United Kingdom – one of which involved the pistol in 1903. From there, I left Wiki and searched “1903 Pistol Act UK” and found a VERY helpful resource page that may in fact show why there was a prevalence of crime, homicide and police activity around the time where a gun control law was placed into effect. Gun violence must have had to happened prior to that in order to instigate an act to control guns in the first place.

According to the Dunblane Resource sheet, the act required that each gun be registered and not be carried by a minor or felon. As we know, most criminals do not follow rules – so maybe this is why there’s an influx in all of the categories in my topic model.

Another huge, famous inspiration that we may also be able to connect to “homicide investigations” being the largest of all peaks in 1903, would be that “Jack the Ripper” was indicted and put to death on April 7, 1903.

Physical Descriptions

Screen Shot 2015-04-02 at 8.50.37 PM

After a bit of intense research on scandal and crime, we are brought to my final topic modeling graph of physical appearances. This was a bit softer topic where it was in turn a bit harder for me to find connections. The trends weren’t very in sync with one another. Apparel peaks high twice, around 1891-1892. This was the section of years that consisted of the collection “The Adventures of Sherlock Holmes,” officially published in 1892. Due to the sheer subject matter of the stories, I can make an inference that descriptions of people’s apparel spiked up here due, in fact, to the publishing of the stories themselves.

Well folks, there you have my take on topic modeling with graphs! Thanks for reading.

Topic Modeling trends – Using Google Fusion Tables

I have chosen abstract topics, which are not too related to History. Nonetheless, I have observed a thematic connection between them, so I divides them into 4 groups.

The related topics of each group show more appearance at the same time periods, suggesting that Arthur Conan Doyle was writing about related themes in each time. Especial concentrations can be seen between 1891-1893, and 1904-1905. After 1908, the release of stories had been constant till the 1920s.

Chart-1
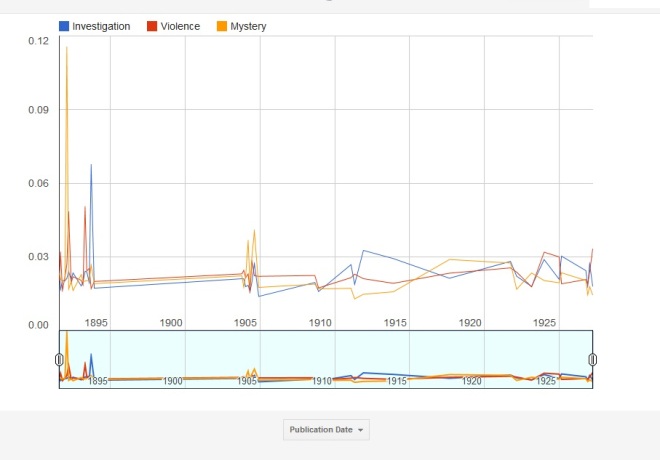
Chart 1: topics 4, 10 and 15 – Investigation, Mystery and Violence

In February 1892, we can see the greatest peak of the whole graph related to the topic “mystery”. This was the release date of The Speckled Band, a story full of words related to mystery, as our class well knows. The peak of “violence” (April 21, 1893), is the release date of The Gloria Scott, a story that ends with a death, which related words are within the “violence” topic. The peak of investigation (September 16, 1893) is related to the story The Greek Interpreter, which involves kidnapping and intimidation, which are material for “investigation”. “Mystery” seems to be the most important topic in the 1904 eight stories, as it stands out from the other topics.


Chart_2
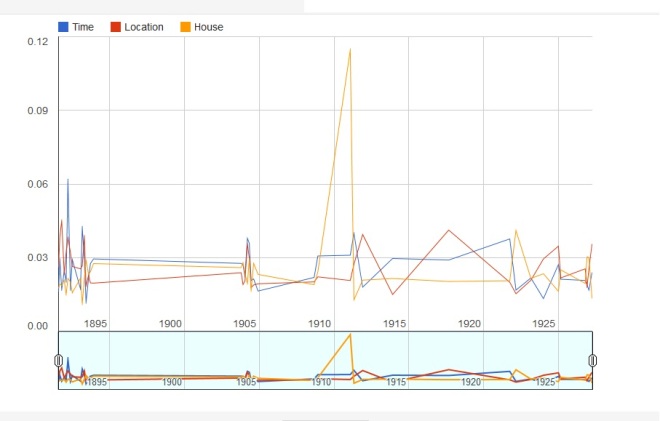
Chart 2: topics 14, 16, 26 – Time, Location, House

The greatest data here are the peaks of “Time”, in March 16, 1892 – release of The Adventure of the Engineer’s Thumb – and “House” in February 1, 1911 – release of “The Disappearance of Lady Frances Carfax”. The first, happens over the summer (time aspect), and the second involves a pursuit along housing environments.


Chart_3
Chart 3: topics 5, 8 and 29 – Conversation, Relationship and Appearance

The principal trends in this graph are a great peak of Relationship in September 1, 1891 (A case of Identity, a story about marriage and the relationship between stepdaugther-stepfather) and a growing appearance of “Conversation” matters in the stories between 1893 and 1903.


Chart_4
I have selected the topic 27 – Sitting – from my 40 topics to the list of the 10 favorite ones.

I have chosen to leave the most different topic one alone in the forth graph. It is “Sitting”, which includes words such as “chair sat room fire bell laid asked lit lamp”.

The first peak is related to the story The Boscombe Valley mystery (October 16, 1891), which involves traveling by train, carriage, driving, actions that might involve terms around “Sitting”. The second peak coincides with The Adventure of Wisteria Lodge (September, 1908), a story that happens inside a house (so it has related terms to “Sitting”).


All the charts in:

https://www.google.com/fusiontables/DataSource?docid=1ufgEjCptMHdlZwv27O3SJHmlyex_8CcmCwR3NSIe