Victorian London Locations Assignment

For my Victorian London Locations Assignment, I chose Wimpole Street as my location to research.

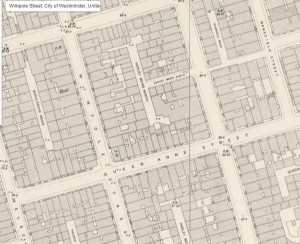
Capture

– Wimpole Street was named after Wimpole Hall, a palatial house in Cambridgeshire.

– Wimpole Street was known for it’s many doctors, opticians, and dentists whose practices were along the street.

– Sir Arthur Conan Doyle himself opened his ophthalmic practice in Upper Wimpole Street in 1891. He began writing short stories when, “five or six months later, … not one single patient had ever crossed the threshold” [a colourful exaggeration that he later contradicted].

The inclusion of Wimpole Street in Blue Carbuncle, although very brief (simply listed as a name along with several other streets), was meant to relate to and seem more realistic for the audience reading the story. Wimpole Street attracted “the cream of London society” where much of the Upper Class visited or resided. Being that a good portion of the audience who read Holmes stories were of the upper class, mentioning Wimpole Street made for a much more compelling story.

*Non Victorian London Fact about Wimpole Street* Paul McCartney actually wrote “I Wand To Hold Your Hand” and “Yesterday” at 52 Wimpole Street while staying with his current girlfriend’s parents.


Source: Willey, Russ. “Wimpole Street – Hidden London.” Hidden London. N.p., n.d. Web. 8 Nov. 2015.
Google Fusion Tables Assignment

For my Google Fusion Tables assignment, I decided to use the software to help compare supercars across the world by country. There are a variety of vehicles in the automotive industry, and surprisingly each country builds there cars very differently.

Data Spreadsheet


Data Cards

FusionCard1 FusionCard2 FusionCard3

These are the data cards of the supercars I compared for this assignment. The data can also be observed in the spreadsheet link above.


Base Price by Country


Fusion1

The first comparison I made with my data was comparing the average base price of the supercars (in USD) by country using the vertical bar chart feature. This helps us draw the conclusion that American supercars appear to be the most affordable, while Italian supercars are more expensive.


Horsepower vs. Torque by Country

Fusion2

The second comparison I made was comparing the ratio of average Horsepower vs. Average Torque by country. Most people tend to only consider horsepower when talking about a vehicle’s power, but torque is also very important in acceleration and power, thus the closer the ratio is in comparison to the horsepower, the better. As we can see by the chart (with average horsepower in blue and torque in red) American cars tend to have the closest ratio of horsepower to torque than any other country.


0-60 Acceleration Performance by Country

Fusion3

While American supercars might look best on paper, the performance numbers are really what is important to determine which vehicle is superior. In this case, using the line chart feature, we can see that although American cars were less than half the price of other cars and had better horsepower to toque ratios, they were not the best performers in 0-60 acceleration due to other variables.


Pie Chart                                                                                      Network Visualization

Fusion6

Fusion7


I didn’t find the pie chart or the network visualization tools very helpful for the sake of this project and the particular data I chose. I used the pie chart to display base vehicle prices by country, and network visualization for weight by country.


Map

Fusion5

Lastly, the map above shows the locations of the automotive manufacturers mentioned previously.


Overall, I found this project to be very interesting, and my favorite thus far in this class. I love learning about the many intuitive tools Google has to offer, and implementing them using data I found.

The link to my final table can be found here.

Google Ngrams Assignment

For this assignment, I used Google Ngrams to track the use of words relating to technology developments in the 19th century.

The first term I decided to search for was “buggy”. Particularly, I was thinking of a horse and buggy. Over time, I hypothesized that these terms would become more and more popular with developments in technology favoring quicker and more advanced transportation, such as buggies. Ngram1


As I predicted, you can clearly see the gradual rise of the use of “buggy” over the course of the 19th century. As buggies began to rise in popularity, so did it’s usage in literature as well.


The second term I chose to search was “rifle”. At first, I expected another gradual rise in usage over time as the technology developed, just like “buggy” did. However, I was even more surprised by what I wound up finding.

ngram2

I was shocked to see such a significant spike in the results! Then upon further research, I quickly found out why. After seeing what events took place during this time period, the real reason for this spike wast the start of the Civil War in 1861. This directly correlates with my findings, with the usage of “rifle” peaking in 1862.

Lastly, I decided to research the term “urban” using Google Ngrams. As I anticipated, the term significantly increased over time.

Ngram3

The gradual slope was even more evident than my first search, further supporting the concept that as technology develops, civilizations grow, populations rise and cities form. The urbanization of society is directly reflected in the usage of the term “urban” itself in 19th century literature.


Overall, this was one of my favorite projects we have worked on in this class. I really found this to be interesting, I have always been looking for a tool like this to notice trends and word usage over time, and now I’ve finally found it! (In literature, at least.) I would love if this same analytic technology could be applied to the usage of certain keywords on the internet over time in shorter time periods, ie. a trending “hashtag” or slang. I’m sure the technology exists- and I will definitely be looking after this exercise to find that as well!


Book Traces Assignment

In looking for Book Traces of previous readers of 19th century books in the library, I came up empty handed. Although I was unsuccessful, I did learn a lot through this assignment and have some guesses as to why I didn’t find any Book Traces in the library.

At first, I had high hopes for this assignment. I was really looking forward to finding old traces of writing in 1800’s books, it didn’t occur to me that people marked up their textbooks years ago too! Initially, I thought finding Book Traces would be an easy task, but as it turned out, it was far from it. One thing I did learn was that our own library was home to over 500,000 books! I imagined I would have no problem finding what I needed, until I learned that only 2,000 of these books were from the 19th century.

There were several reasons why I believe I didn’t find any Book Traces in our library. One of the biggest being the supply- with less than 1% of the books in the Sojourner Truth Library being from the 19th century, it seemed like finding a needle in a haystack. It was also discerning to find out that the library largely eliminates any book donations they get with writing in them. For the sake of Book Traces, I think it would be nice if in the future, our Library preserved and maintained Book Traces (so long as they didn’t infringe on the actual text of the book) and made an effort to have more 19th century books with Book Traces.

Another issue I had was finding appropriate 19th century books that would have writing in them. I searched through dozens of books, and I kept running into old Encyclopedia/ Textbooks, instead of any with literature or stories in them. Some titles included “Religious Science”, “Complete Works of Shakespeare” and so forth. To my surprise, not many old textbooks were marked in nearly as much as newer editions are today. My theory is that these old books were kept as sets, and remained untouched on shelves for much of their lives. I did try searching for keywords such as “journal” and “diary” to find some better material with a higher probability for booknotes, but still did not have any luck.

Although I was not successful this time around, I hope to have future encounters with Book Traces, and look forward to when I can find some Book Traces of my own!

Victorian Era Assigment

In browsing Lee Jackson’s Victorian London Dictionary, I decided to research more about the food of that era, specifically their meal habits. One I found particularly interesting was breakfast. In Victorian London, breakfast was widely served at 9:00am. “So hungry London breakfasts, but not uniformly well, at nine o’clock in the morning.”  With the exception of the upper class, who dined at 10:00am.

Their breakfasts mainly consisted of poached eggs, rashed bacon, bread and butter, etc. “I want to know how many thousand eggs are daily chipped, how many of those embryo chickens are poached, and how many fried; how many tons of quartern loaves are cut up to make bread-and-butter, thick and thin; how many porkers have been sacrificed to provide the bacon rashers, fat and streaky…”

Many also had fish with breakfast, being that London had a large fishing industry. Overall, I found all of these discoveries very interesting, as a glimpse into what life was like in Victorian London.