Google Ngram provides a methodically chromatic and interpretive conception of visualizations of books in various time periods. It is quite interesting to see what types of words and concepts are prevalent in variant centuries. In the earlier periods, people were much more conformist and conventional then the later epochs of time. Distinctive and dissimilar concepts are utilized at different times. However, one has to be extremely meticulous when utilizing Google Ngrams, as it is highly case sensitive and can change one’s results drastically. Besides this negative quality, it is a very expedient and beneficial tool that can be used for a numerous amount of purposes.
For my first graph, I wanted to see what would be the visualization with the words “sex” and “marriage”. I was theorizing that marriage would be more popular in the 1800s to late 1900s as people were quite traditional and did not believe in adultery. I thought sex would become more and more popular as time passed and as generations modernized. So I searched for those two words and came up with this graph:

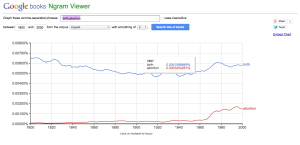
Another highly critical and crucial comparison that would be interesting to visualize are birth and abortion. It would be quite beneficial contain a perspective of how the legal system and the morality was like during the earlier 1800s and 1900s. As adultery was not common in the earlier centuries, abortion would not exist to be popular as well due to the traditions of child bearing and having a large number of children. The issue of abortion would have become more familiar in the 2000s, as it would keep on increasing throughout the graph. Here is the visualization:
