FUN Factor Analysis Lab
(adapted from Becky Warner’s work for her book Applied Statistics)!
Factor Analysis is a kind of statistic that allows for an assessment of whether there are some basic factors (or dimensions) that underlie several potentially related variables. For instance, a factor analysis can provide information regarding whether some core, basic personality traits underlie a large battery of items from a personality test.
A factor analysis conducted on a set of variables addresses the following questions:
1. How many basic dimensions or factors underlie a set of variables?
2. What are the dimensions?
3. What items/variables ‘load onto’ or correspond to each dimension?
Consider the following example: Is gender a unidimensional quality – with two separate ‘endpoints’ of masculine and feminine OR are masculinity and femininity two separate dimensions?
The Bem’s Sex Role Inventory (BSRI; 1974) was designed to explore this particular question. Sandra Bem was particularly interested in whether people could score as both masculine and feminine, suggesting that there are two separate dimensions that underlie gender identity.
Consider Robert Belli’s data from this scale (it can be found here).
You’ll see scores from nine items from the BSRI (warm, loving, affectionate, nurturant, assertive, forceful, strong person, dominant, and aggressive). To factor analyze these scores, while in data view,
1. click on ‘analyze’
2. click on ‘dimension reduction’
3. click on ‘factor’
3A. A dialog box will appear.
4. Take all variables from left column that you want to include in the analysis (each variable corresponding to each of the nine BSRI variables described prior) and transfer them to the ‘variables’ box.
5. click on the ‘extraction’ box
6. Under ‘method,’ choose ‘principal axis factoring’
7. click ‘continue’
8. under ‘rotation,’ click ‘varimax’
9. click ‘continue’
10. click ‘paste’
You will get commands added to an SPSS syntax (.sps) file that looks like the following:
FACTOR
/VARIABLES nurtrant afctnate warm cmpssnte asertive strpersn forceful
dominant agrssive /MISSING LISTWISE /ANALYSIS nurtrant afctnate warm
cmpssnte asertive strpersn forceful dominant agrssive
/PRINT INITIAL EXTRACTION ROTATION
/CRITERIA MINEIGEN(1) ITERATE(25)
/EXTRACTION PAF
/CRITERIA ITERATE(25)
/ROTATION VARIMAX
/METHOD=CORRELATION .
11. Highlight that syntax.
12. click ‘run’
13. click ‘selection.
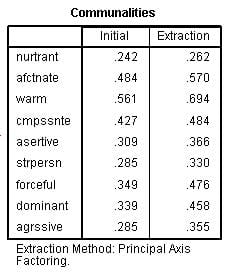
You will obtain SPSS output that looks like the following:


The ‘eigenvalues’ provide a sense of how strong the extracted factors are. A common way to address eigenvalues is to only try to interpret factors with eigenvalues that are greater than 1.0.
Note that of each of the nine possible factors, only two have eigenvalues that are greater than 1.0 (Factors 1 and 2).
Given how we set up the analysis, SPSS only provides a factor loading table for these two factors.
In addition to the standard unrotated factor loading table, SPSS also provides us here with a ‘rotated’ factor loading table. This table is generally easier to interpret than the unrotated table.
Each ‘loading’ corresponds to the correlation between a particular variable and the ‘factor.’ We can look at variables that are ‘strongly loaded’ onto each factor to attempt to label each factor.
Relatively high factor loadings are actually somewhat subjective – as a quick rule, typically loadings that are greater than .3 in absolute value are potentially worth considering as illustrative of a particular factor.
Using that rule, based on our interpretation of the rotated factor loading table, we find that four variables seem to load strongly onto ‘factor 1.’ These items (i.e., variables) are nurturant, affectionate, warm, and compassionate. Items that load strongly onto ‘factor 2’ are assertive, strong person, forceful, dominant, and aggressive.
These findings suggest that gender identity may in fact be bi-dimensional, with masculinity and femininity being two separate dimensions. Males and females may be high on both dimensions.
These findings would be presented in a Results section as follows:
A factor analysis using the principal axis method of extraction was conducted to examine whether scores on nine gender-relevant trait items from the Bem Sex Role Inventory (warm, loving, affectionate, nurturant, assertive, forceful, strong person, dominant, and aggressive) correspond to multiple underlying factors. The analysis extracted two factors with eigenvalues that are greater than 1.0. The first of these factors accounted for 26.07% of total variability in scores while the second factor accounted for an additional 18.33% of variability in scores.
The rotated factor loading table (see Table 1; based on SPSS’s VARIMAX rotation) suggests that the first factor corresponds to femininity (with relatively high loadings for such items as nurturance, and compassion) while this table suggests that the second factor corresponds to masculinity (with relatively high loadings for such items as dominance, and assertiveness). These findings support the notion that gender identity is likely bi-dimensional as opposed to uni-dimensional.
Table 1
Rotated Factor Loadings for Scores on Nine Items from the Bem Sex Role Inventory
Femininity Masculinity
BSRI Item:
Nurturant .49 -.15
Affectionate .71 .25
Warm .80 .22
Compassionate .70 .00
Assertive .15 .59
Strong Person .23 .53
Forceful -.17 .67
Dominant .00 .67
Aggressive .00 .59
Assignment:
For this assignment, you’ll refer to two files from my website. Open the first, ‘fa_examp.doc,’ to see a personality scale. This scale was developed by Collins and Read (1990) and is comprised on items designed to tap how people are attached to romantic others.
Next, open ‘fa_examp.sav.’ This file is an SPSS data file with real data from over 100 participants. These participants completed the attachment style scale included in the .doc file.
Your job is to run a principal axis factor analysis on these data. In doing so, follow the steps used in the BSRI example (from above). Note that while SPSS may extract multiple factors with eigenvalues greater than 1.0, you may well not be able to interpret all such factors easily and you are not required to provide a coherent interpretation for all such factors.
After you run the analysis, provide a ‘results’ section similar to the one included in this lab for the BSRI. Do your best job at interpreting the factors from Collins and Read’s (1990) scale. Note that there are multiple solutions and that there is a bit of subjectivity in this interpretation process – so do your best and have fun!