


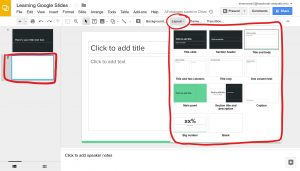
- To change the layout of a slide, click on the slide you want to change on the left, then select the Layout tab. These options will appear, all of which are customizable as you can always delete, add, or adjust each text box.
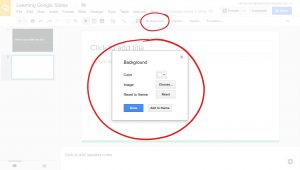
- Once you have a layout that you like, you can change the background by selecting the Background tab. This small screen will appear, where you can add an image background or simply change the color.
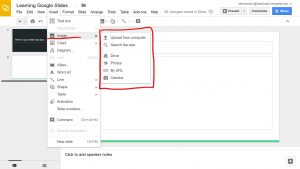
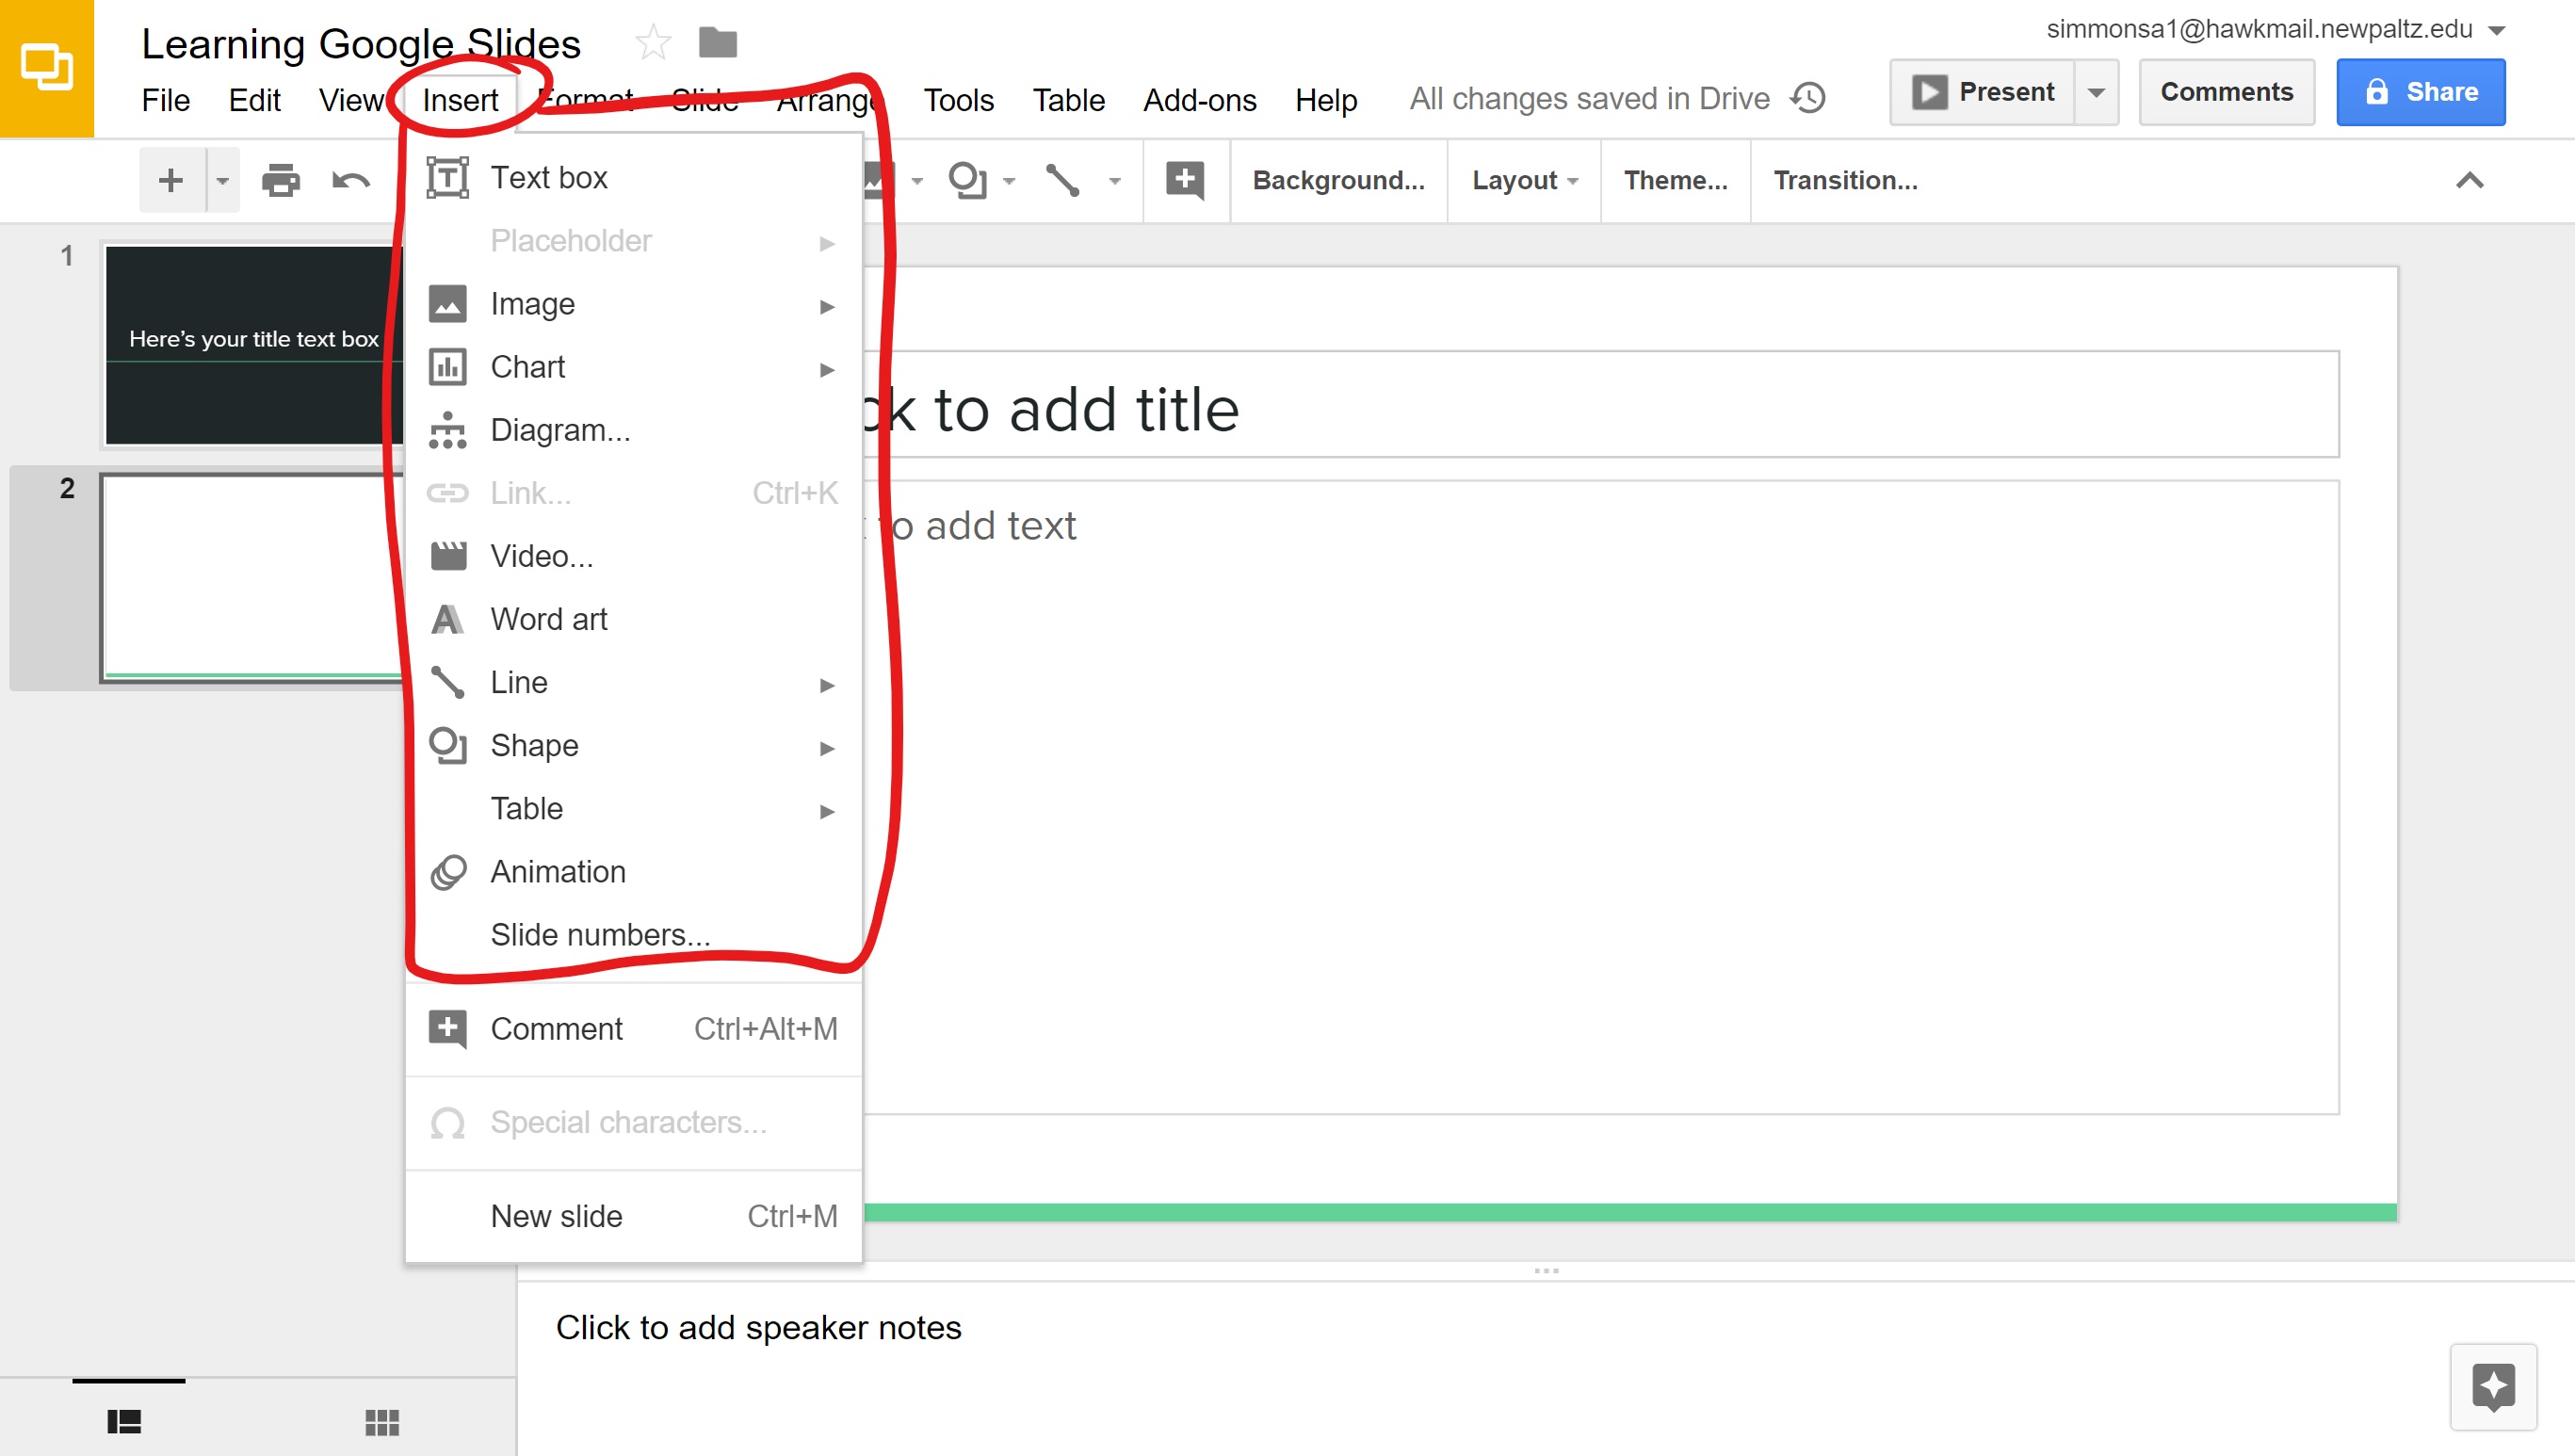
- You can insert images, text, and charts to your slides all in the Insert tab.

- Two of the most common inserts are images and charts. First click on the Insert tab then hover your cursor over the Image tab and all six of these options can be used to add an image.
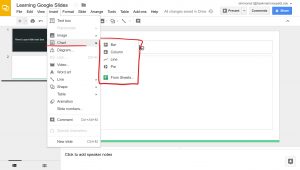
- To add a chart follow the same steps as above. Click on the Insert tab then hover your cursor over the Chart tab and these 5 options will appear.
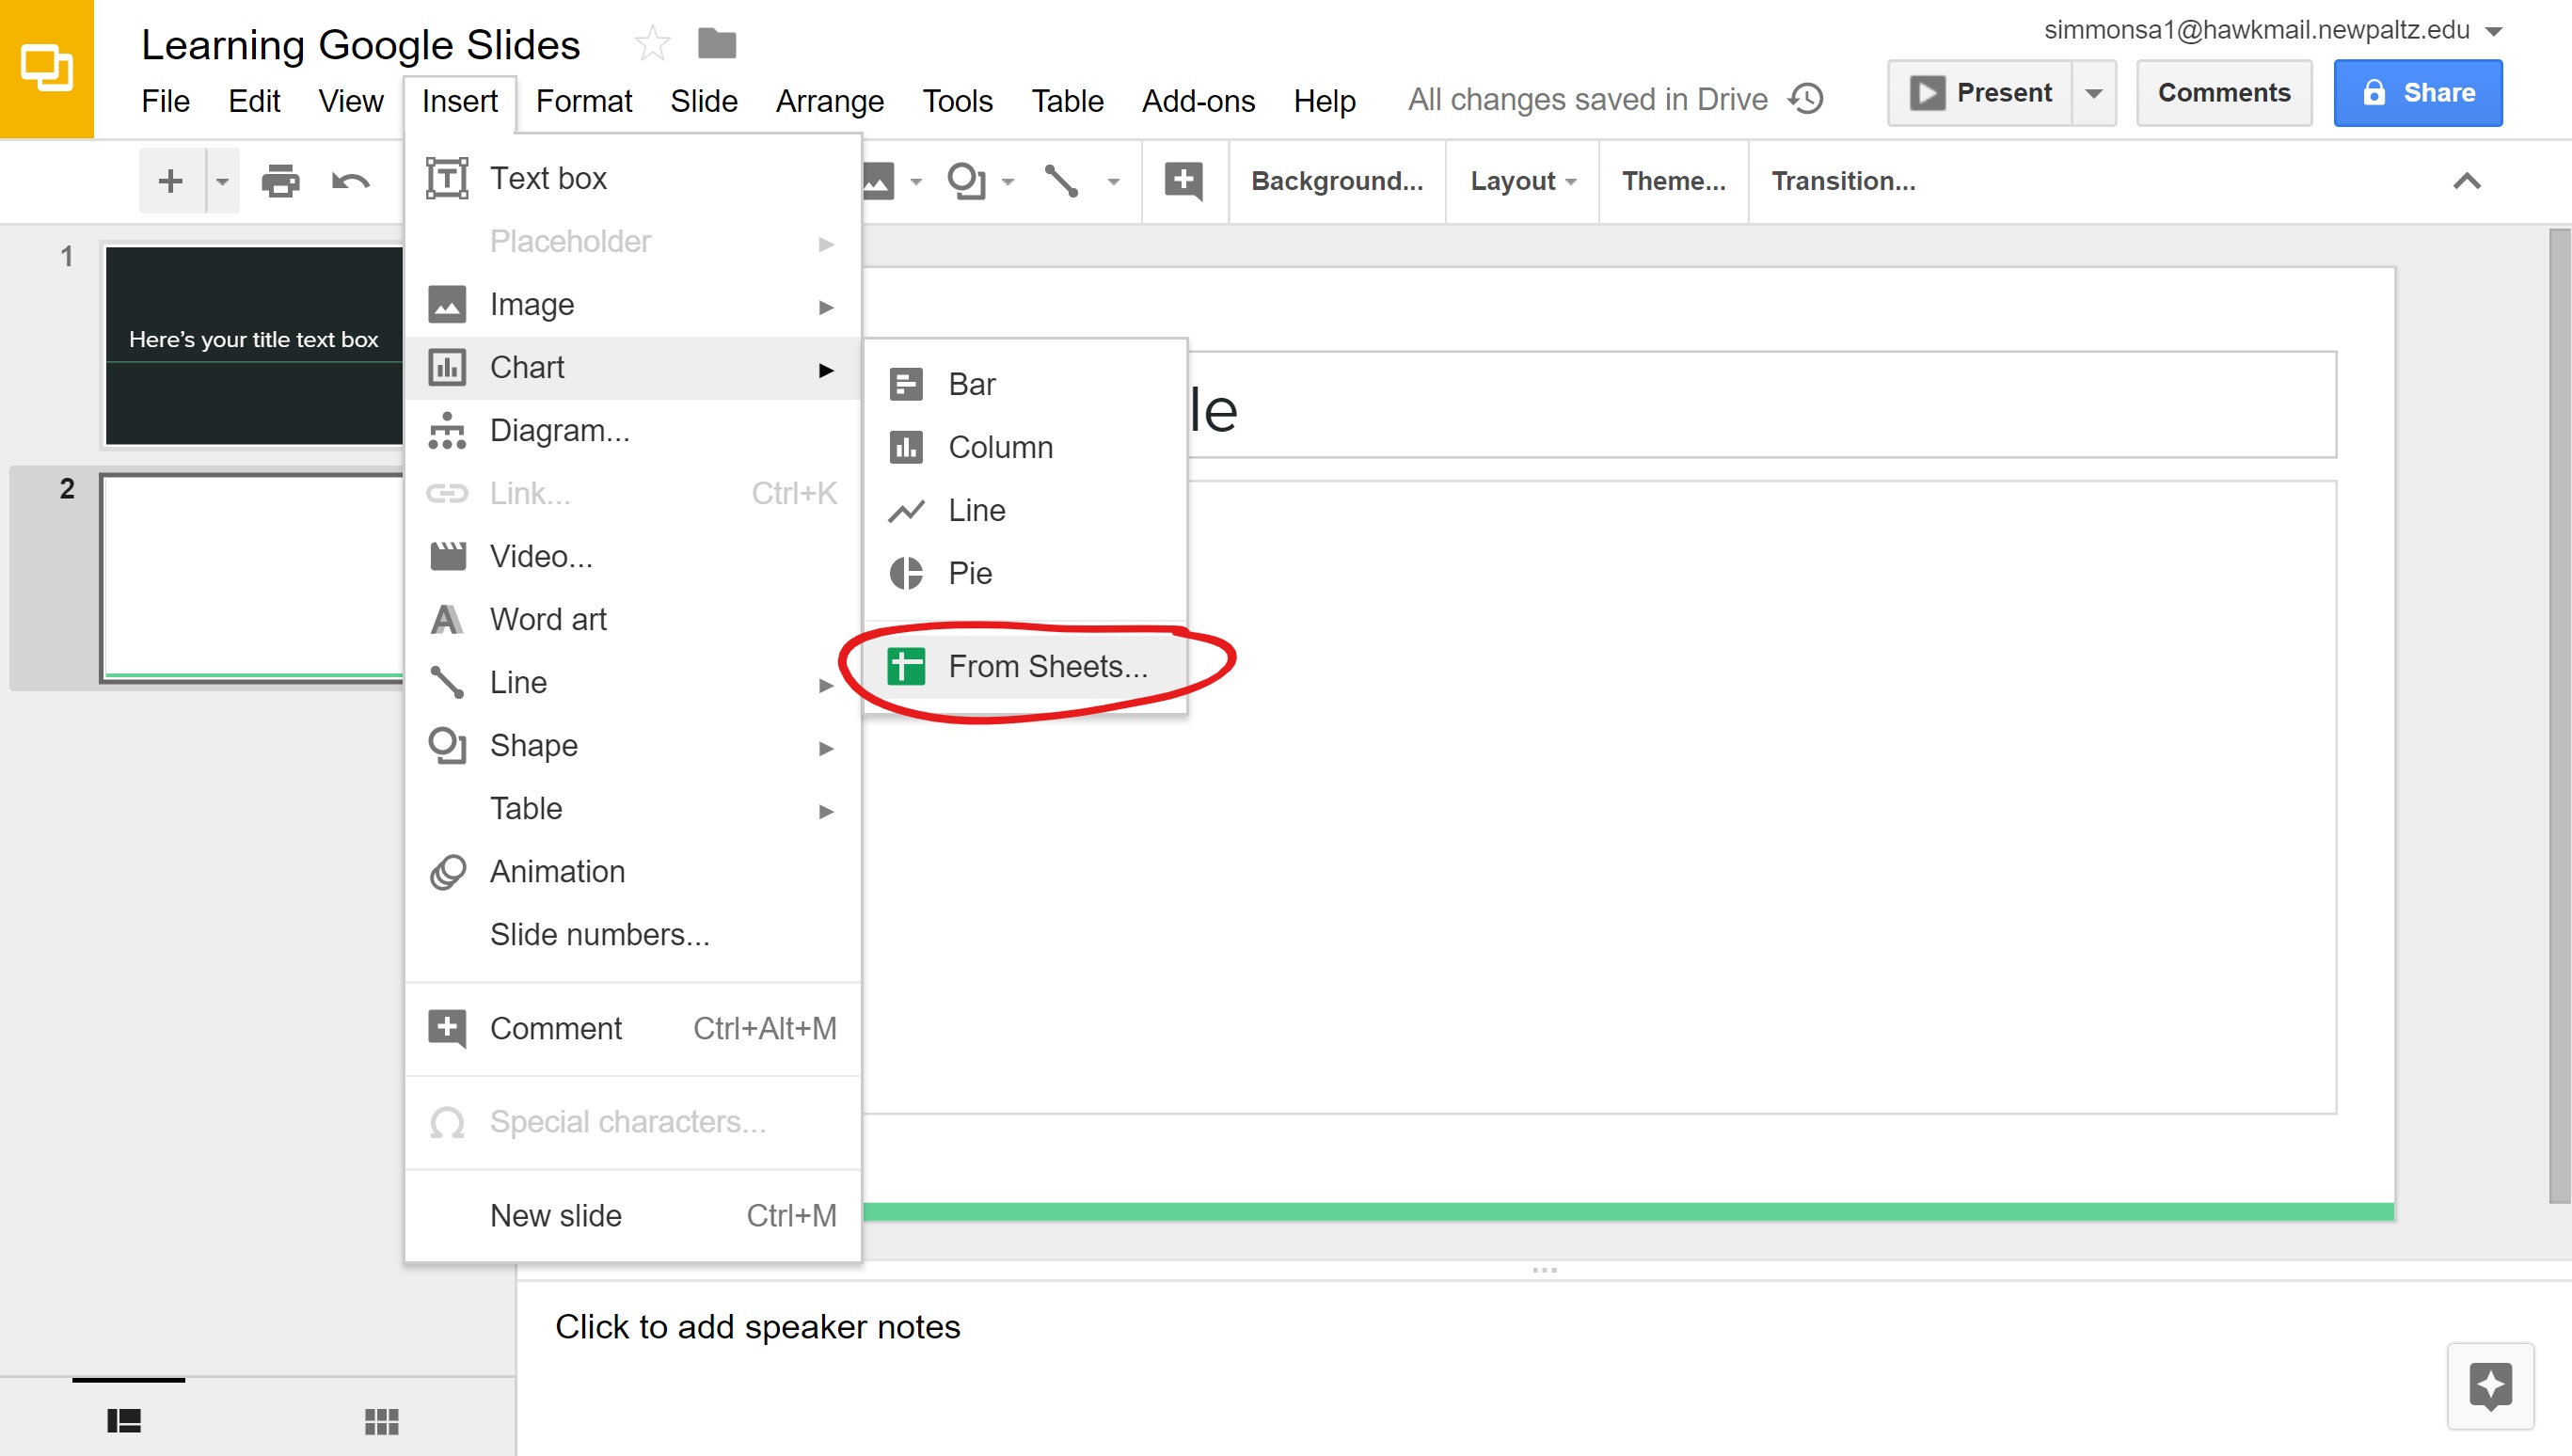
- You can add a chart directly from Google Sheets if you’ve already created a data set or a chart by clicking on From Sheets.

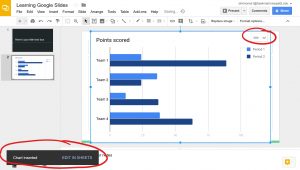
- To add a whole new chart select one of the four chart options. We selected a bar graph, when it appears this message will pop up on the bottom left. To change the data for the chart click on Edit in Sheets. You can also edit it by clicking the link button on the chart and selecting Open source.
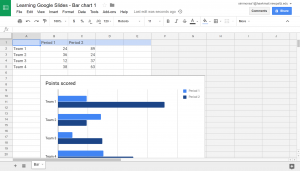
- Doing this will bring you to a Google Sheet page, similar to this one here, where you can change the data for the graph that appears on your slide.
- That’s the basics for Inserting and Layouts, the last blog will cover presenting your Google Slide.


Comments are Closed


You must be logged in to post a comment.