Instructions:
In the groups you used for your previous mapping exercise, you will use both Google Maps and Mapbox to create a map of the locations in the Holmes story you selected.
To submit the assignment:
1. Embed and link to your Mapbox map on our class blog and include the names of your groupmates in the post.
2. Your map should have lines connecting the locations and an appropriate picture for each location.
DUE
November 12 by 8pm.
Preparing the Data:
- Visit http://goo.gl/forms/bpUz4c0MfO and fill in the form with data about your selected location from a Holmes story: longitude, latitude, location name, and description of what happens at that location (including the page number of the relevant passage of the story).
- Follow these directions to get the longitude and latitude of your location: http://www.wikihow.com/Get-Longitude-and-Latitude-from-Google-Maps
- This creates a Google spreadsheet with information about each location in each story
- When the spreadsheet is complete, go to “File” -> “Download As” -> “Comma-Separated-Values” (.csv); This saves the data as a .CSV file, which is necessary for mapping projects.
Set up for Google Maps:
NOTE: I will actually import the spreadsheet into Google Maps for you and then share the map, so you will skip steps 1-6 for now, but the instructions here will teach you how to import your own spreadsheet for future reference.
- Log into Google (with a non-Hawkmail account)
- Navigate to maps.google.com
- Click on the icon with three horizontal bars in the left-hand side of the search bar.
- Click on “My Maps.”
- Click on “Create” and give your map a title and a description by clicking on the words “Untitled Map” in the upper-left hand side of the screen and completing the empty fields.
- There are two ways to add data:
- Option 1: Adding locations individually:
- Type a location in the search box, (e.g. 221B Baker Street, London), click on the resulting point, and then click “Add to Map”
- Option 2: Import data from a spreadsheet (we’ll be using this)
- Click “Import” in the box on the left.
- Click the blue “Select a File from your Computer” button, find the file, click it, and then click “open.”
- When asked for the longitude, latitude, and title columns, select them.
- Congrats! Your data has been imported!
- Option 1: Adding locations individually:
Using the Class Google Map:
Editing Google Maps Data
- First, let’s color-coordinate the locations by story
- Click where it says “Uniform Style” and change it to “Individual Style.”
- Now, each story is listed in the box on the left; the icon on the left shows the location’s color, and the number of the right shows the number of locations per story.
- Decide in your group what color you’d like to use for your story.
- Hover over your location in the left-hand box and click on the icon that appears on the right.
- Select a color and shape from the drop down menu to determine the appearance of the location pins for your story.
- Next, let’s add an image to a location
- Find your location and click on it; a window should pop up with information about it.
- Click on the icon in the shape of a pencil and click on the icon of a camera.
- Do a Google image search for your location to choose a picture of the area, click on the image you want, and click “Select”
- Click “Save” to save your picture.
- Finally, let’s add lines to connect the locations in the story
- Figure out the order of locations in the story
- Select the first spot in your story, and then click the icon with circles and select “Add line or Shape” (or “Add Walking Route” if the characters walk between the points).
- Click on each story location in order and hit enter when you’re done
- To change the line’s appearance or color, hover over the words “Other/No value” near where the story titles are listed in the left box and click the icon that appears.
- Select the desired color and line width.
- You’re done! Congrats!
Using Mapbox:
Mapbox (https://www.mapbox.com/) is another great mapping program that lets you customize things a little more and makes more elegant maps. However, it doesn’t let multiple people edit the same map simultaneously, so you’ll have to work together.
Importing Data:
- Download the class’s CSV file.
- Choose one person in your group to make a Mapbox account and log in (https://www.mapbox.com/education/).
- Click on “New Project”
- Select the background map you want.
- Click on “Data” -> “Import” and select the CSV file.
- The next window will ask you to connect columns in the CSV file with basic data fields: for Title, select “Title”; for Description, select “Description.” Then, choose the color and icon size you want associated with your story.
- Congrats! You’ve imported your data!
- Click on “Project,” -> “Settings” and give your project a title and a description.
- Click the “Save” button.
Editing Data:
- First, delete all data points that aren’t in your story by clicking on the icon with three horizontal lines, and clicking the trash can for every data point that isn’t in your story.
- Next, each group member should take turns clicking on their location and editing its appearance
- Click “Symbol,” and select a symbol that represents the location.
- Click “Text” and follow these instructions to add a picture
- Do a Google image search to find the perfect image for your location.
- Once you’ve found it, right-click and get the image URL.
- At the end of your description in the “Add a description” field, click your curser.
- Next, you need to type some HTML to make the picture appear!!
- Type <img src=”[insert image]”>For example, if I wanted this picture of Baker Street associated with Baker street, I would type <img src=”https://shipscooksstuff.files.wordpress.com/2012/02/baker3.jpg”>
- Click the “Save” button.
- Finally, remember the order in which the locations appear in the story, and get ready to draw lines.
- Click the “Line” button, then click on the correct points in order.
- Double-click on the final location.
- Give the line a name (e.g. “Order of events in “A Scandal in Bohemia”) and a color.
- Click the “Save” button.
- To see what your map looks like, click “Project” -> “Info,” and copy the URL listed under “Share” into a browser.
- Copy the “Share” URL into a new blog post along with the embedded completed map and your group members’ names.
- To embed the map:
 a. Click “Project” -> “Info,” and copy everything from the text box labeled “Embed”
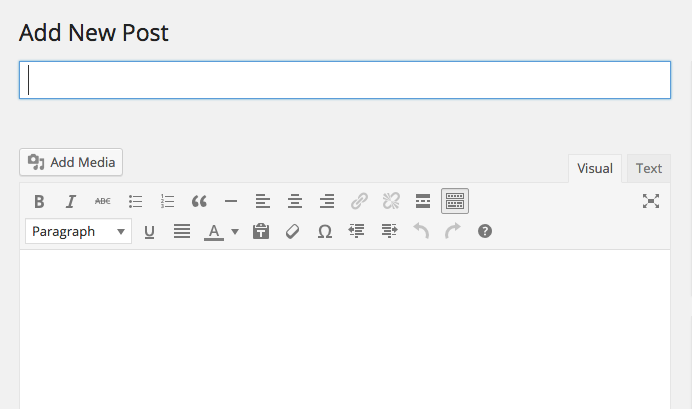
b. On the blog posting page, click on the tab labeled “Text” (it should be right next to the tab labeled “Visual”).
c. Copy and paste the embed code there.